Content
Rush to sell
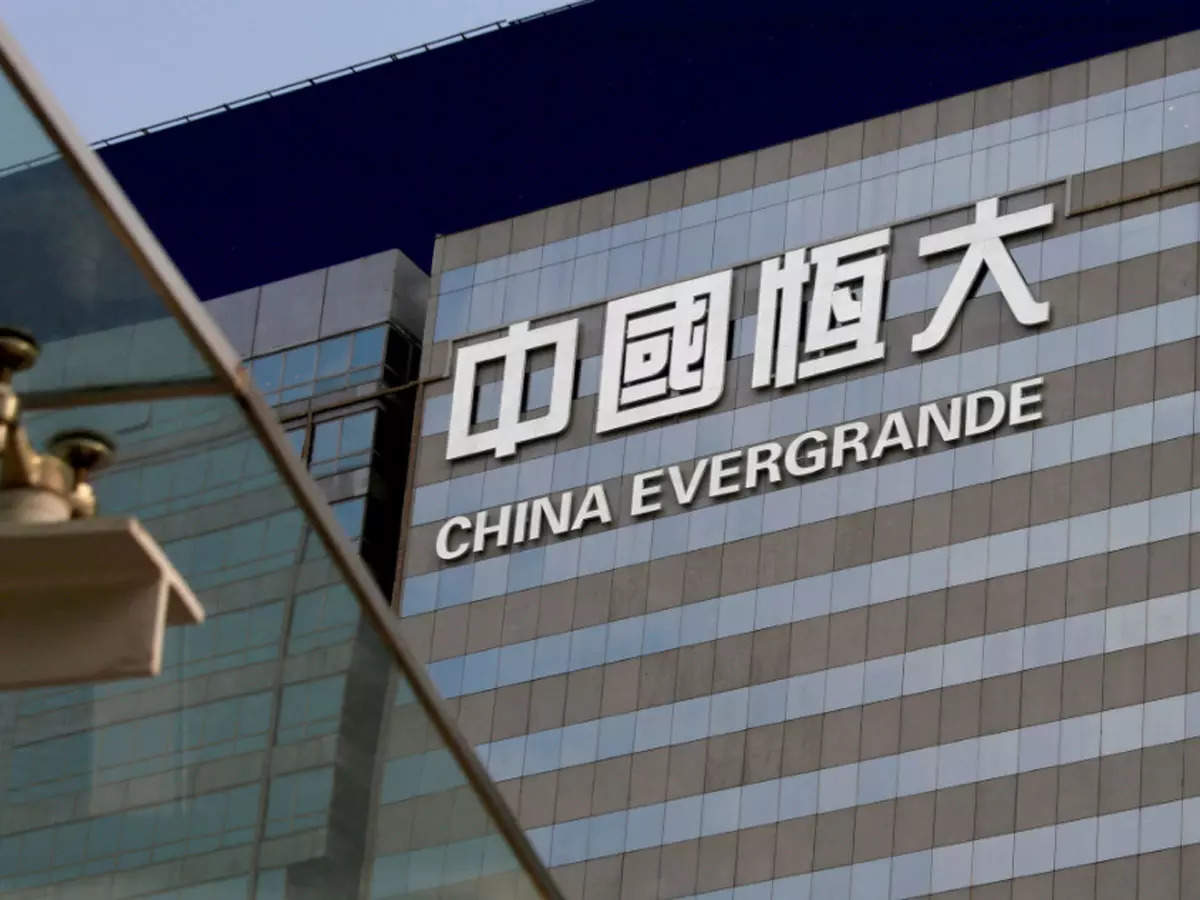
Black Friday had been brought forward for both Chinese domestic and global investors. Only this time, they crowded together to sell everything from Evergrande’s US-dollar bonds to its H-stock in order to decrease risk exposure to China real estate industry as quick as possible. People are concerned about whether Evergrande will turn out to be China’s Lehman Brothers because so many banks and non-bank financial institutions either gave loans or held bonds and equity of Evergrande in their products. If the company defaults and goes bankrupt in the end, there is a moderate possibility to incite a systematic risk event that costs an exhausted global market which just begins to take some air from the impacts of the pandemic. Therefore, investors are trading the worst scenarios and Evergrande’s Hong Kong stock price has slumped more than 80% so far this year.
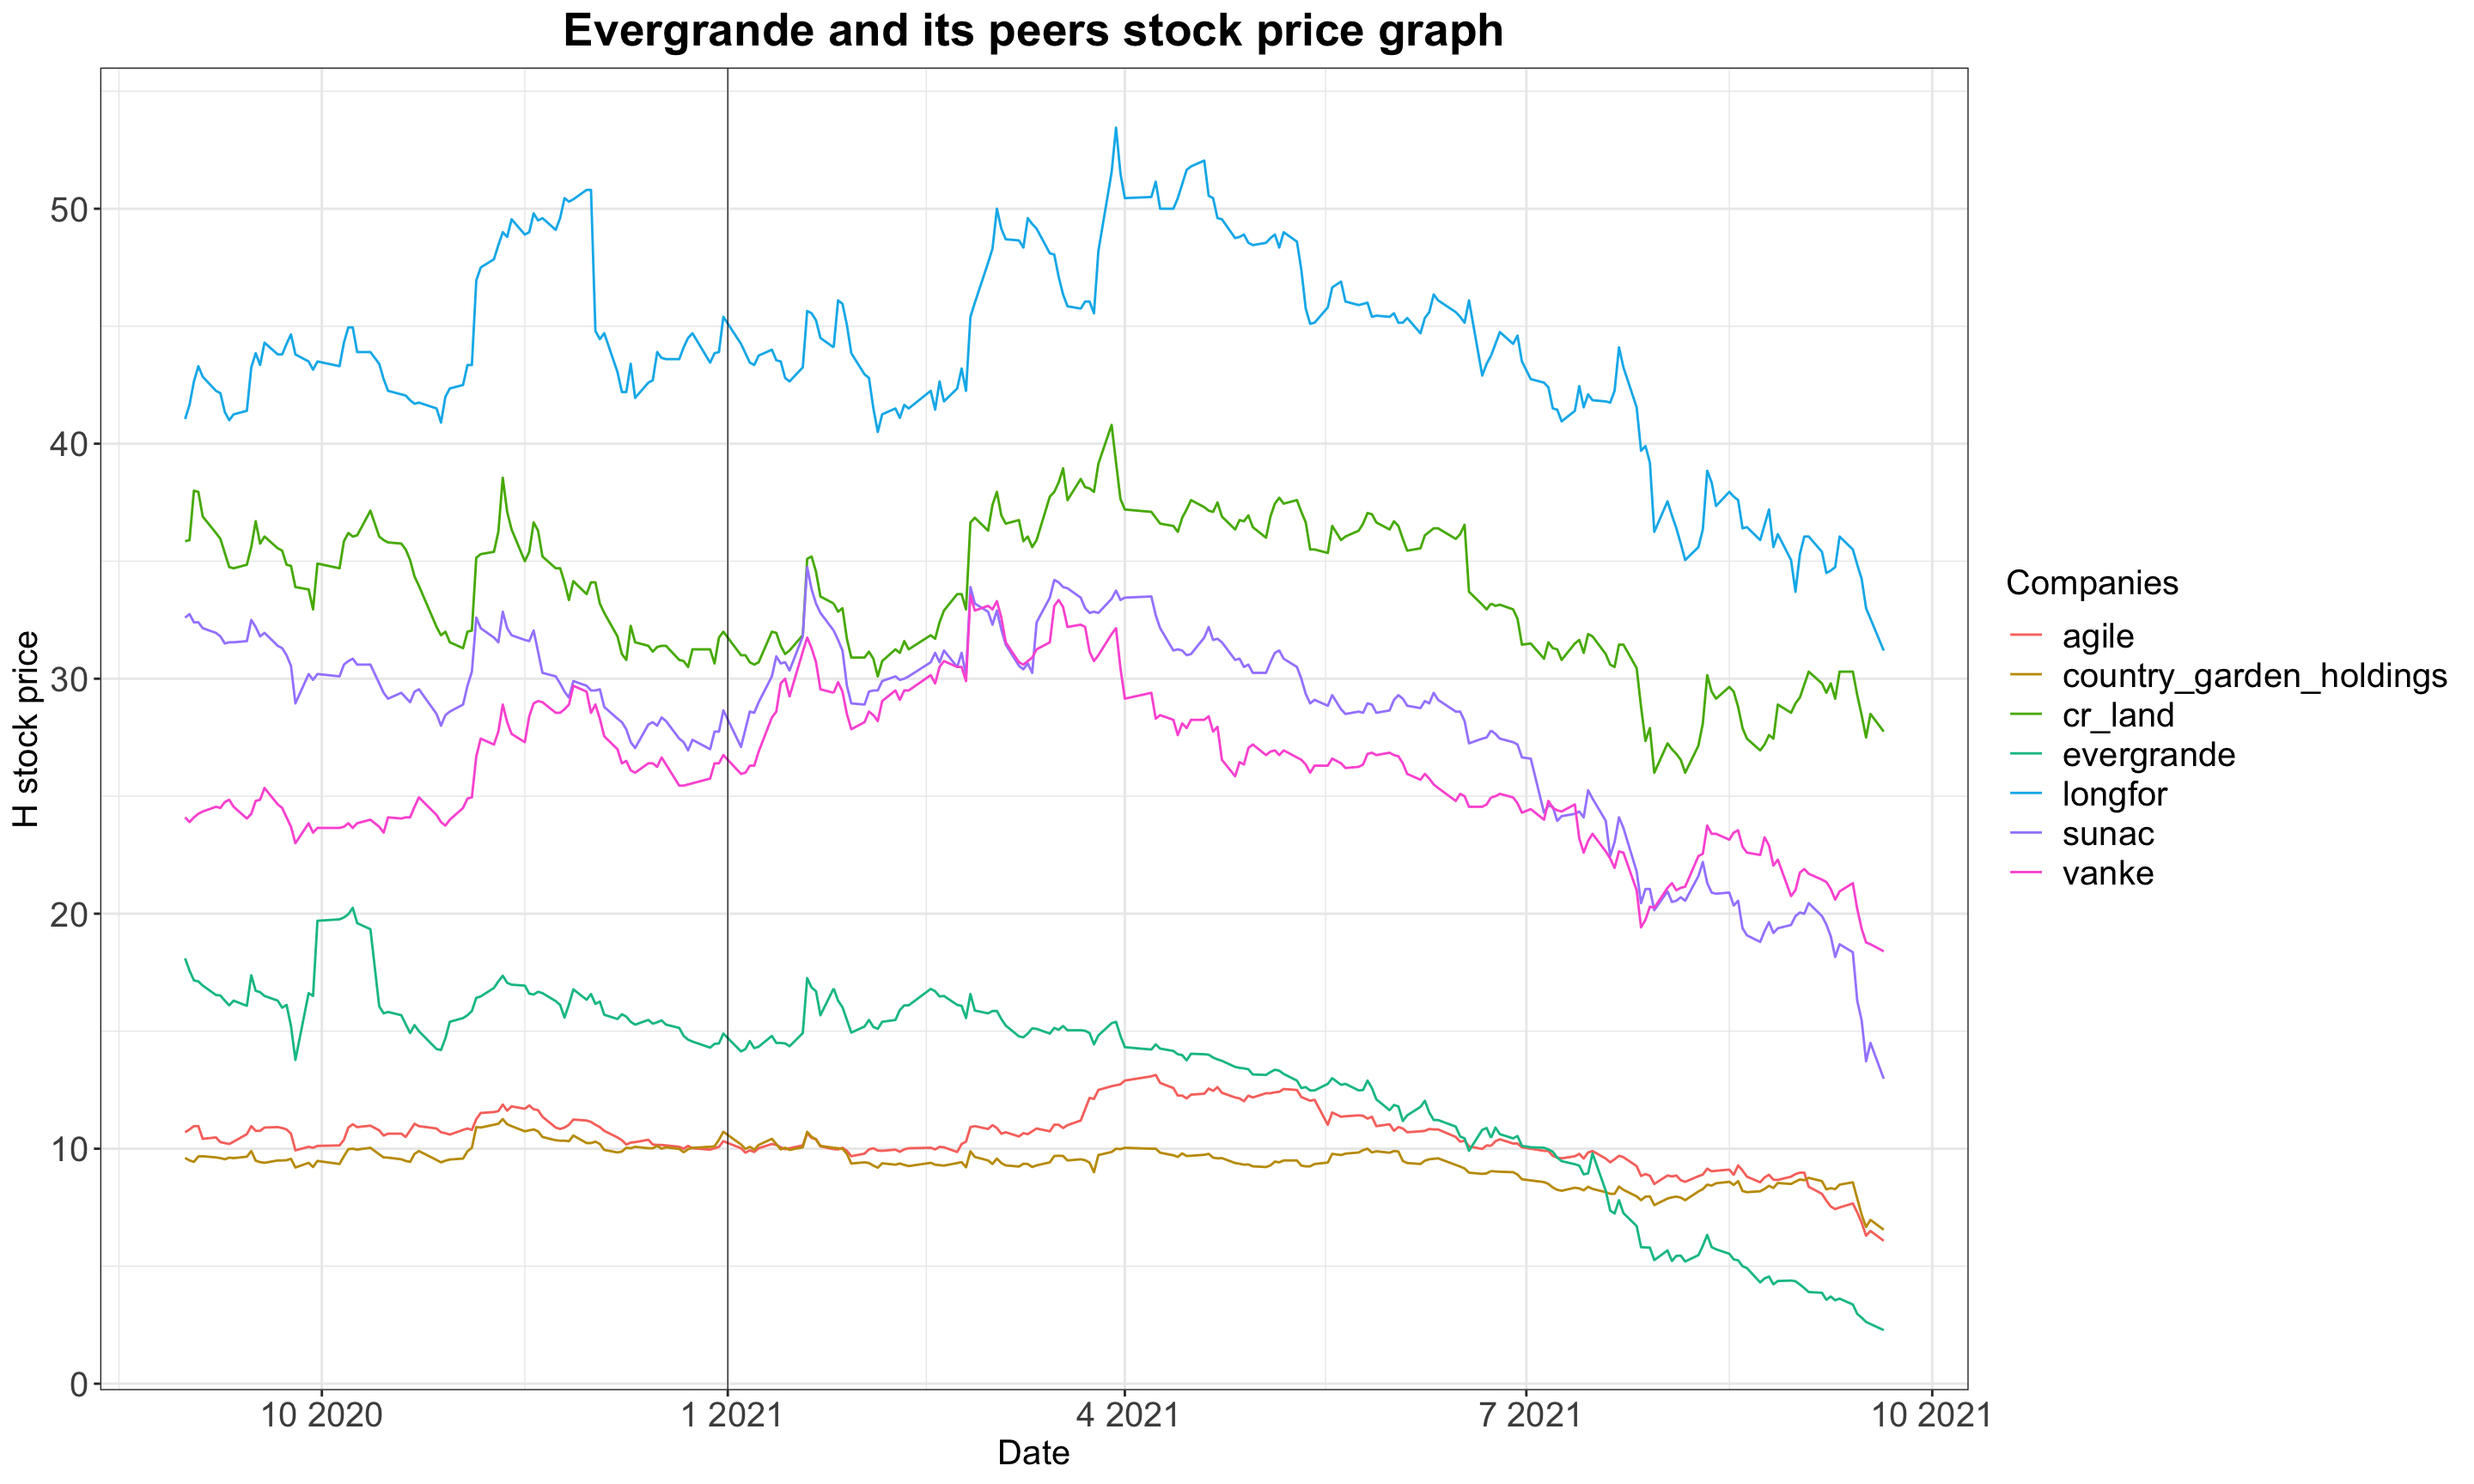
However, as you could see, not only Evergrande, but alone with other major real estate companies, have suffered great loss on their stock price, demonstrating the fact that this is a common problem for the whole real estate sector in China. Considering the fact that the real estate industry contributes roughly 30% of China annual GDP, this problem could exacerbated and extended even further to China’s growth story, ruining growth expectation years ahead. Many analysts had cut their forecasts of this year’s China GDP growth to a level lower than 8%. Unsurprisingly, Evergrande has been downgraded as well based on its credit risks attached by three major credit rating agencies, and all of them have revised ratings of Evergrande US-dollar bonds from B to C so far this year, resulting in the free dive of company bond prices and a significant rise of YTM.
Evergrande US-dollar bonds and CN-yuan bonds dropped heavily around 70% and you could notice that there was a sudden bounce back at the end of August in Yuan-Dominated bonds. That’s because there were rumors that the state government would provide assistance to Evergrande debt issue and the company was willing to solve its suppliers and wealth management product problems primarily. However, foreign investors usually don’t get many special treatments and care from the Chinese government and so it seems that domestic investors are more confident than their foreign counterparts regarding how this would unfold. We could run two more correlation tests to prove that.
Correlation test between US-Dollar dominated bond and CHINA-Yuan dominated bond:
##
##  Pearson's product-moment correlation
##
## data:  x and y
## t = 28, df = 391, p-value <2e-16
## alternative hypothesis: true correlation is not equal to 0
## 95 percent confidence interval:
##  0.7860 0.8509
## sample estimates:
##    cor
## 0.8211
##
## Pearson's product-moment correlation
##
## data: x and y
## t = 28, df = 391, p-value <2e-16
## alternative hypothesis: true correlation is not equal to 0
## 95 percent confidence interval:
## 0.7864 0.8512
## sample estimates:
## cor
## 0.8215Correlation test on bonds under same currency:
##
##  Pearson's product-moment correlation
##
## data:  x and y
## t = 82, df = 391, p-value <2e-16
## alternative hypothesis: true correlation is not equal to 0
## 95 percent confidence interval:
##  0.9662 0.9772
## sample estimates:
##    cor
## 0.9722
##
## Pearson's product-moment correlation
##
## data: x and y
## t = 69, df = 391, p-value <2e-16
## alternative hypothesis: true correlation is not equal to 0
## 95 percent confidence interval:
## 0.9533 0.9683
## sample estimates:
## cor
## 0.9615Supplement T-test:
##
##  Welch Two Sample t-test
##
## data:  Price by Bond_ID
## t = 7.2, df = 468, p-value = 3e-12
## alternative hypothesis: true difference in means between group af222581_CNY and group ao063630_USD is not equal to 0
## 95 percent confidence interval:
##   7.391 12.959
## sample estimates:
## mean in group af222581_CNY mean in group ao063630_USD
##                      81.44                      71.27
These test results prove the fact that performances of bonds in different regions tend to be more similar with peers of the same. All correlation tests’ p-values are lower than 1% thus statistically significant and the correlation is higher than 95% between bonds of the same currency. This finding asserted the assumption that investors behaved by different information sources. We further did a t-test as a supplement to support our assumption that Chinese investors are more sensitive and confident to the rumors of Evergrande debt issue and results showed that domestic bonds’ mean prices are significantly higher than those of dollar dominated, bolstering our assumption.
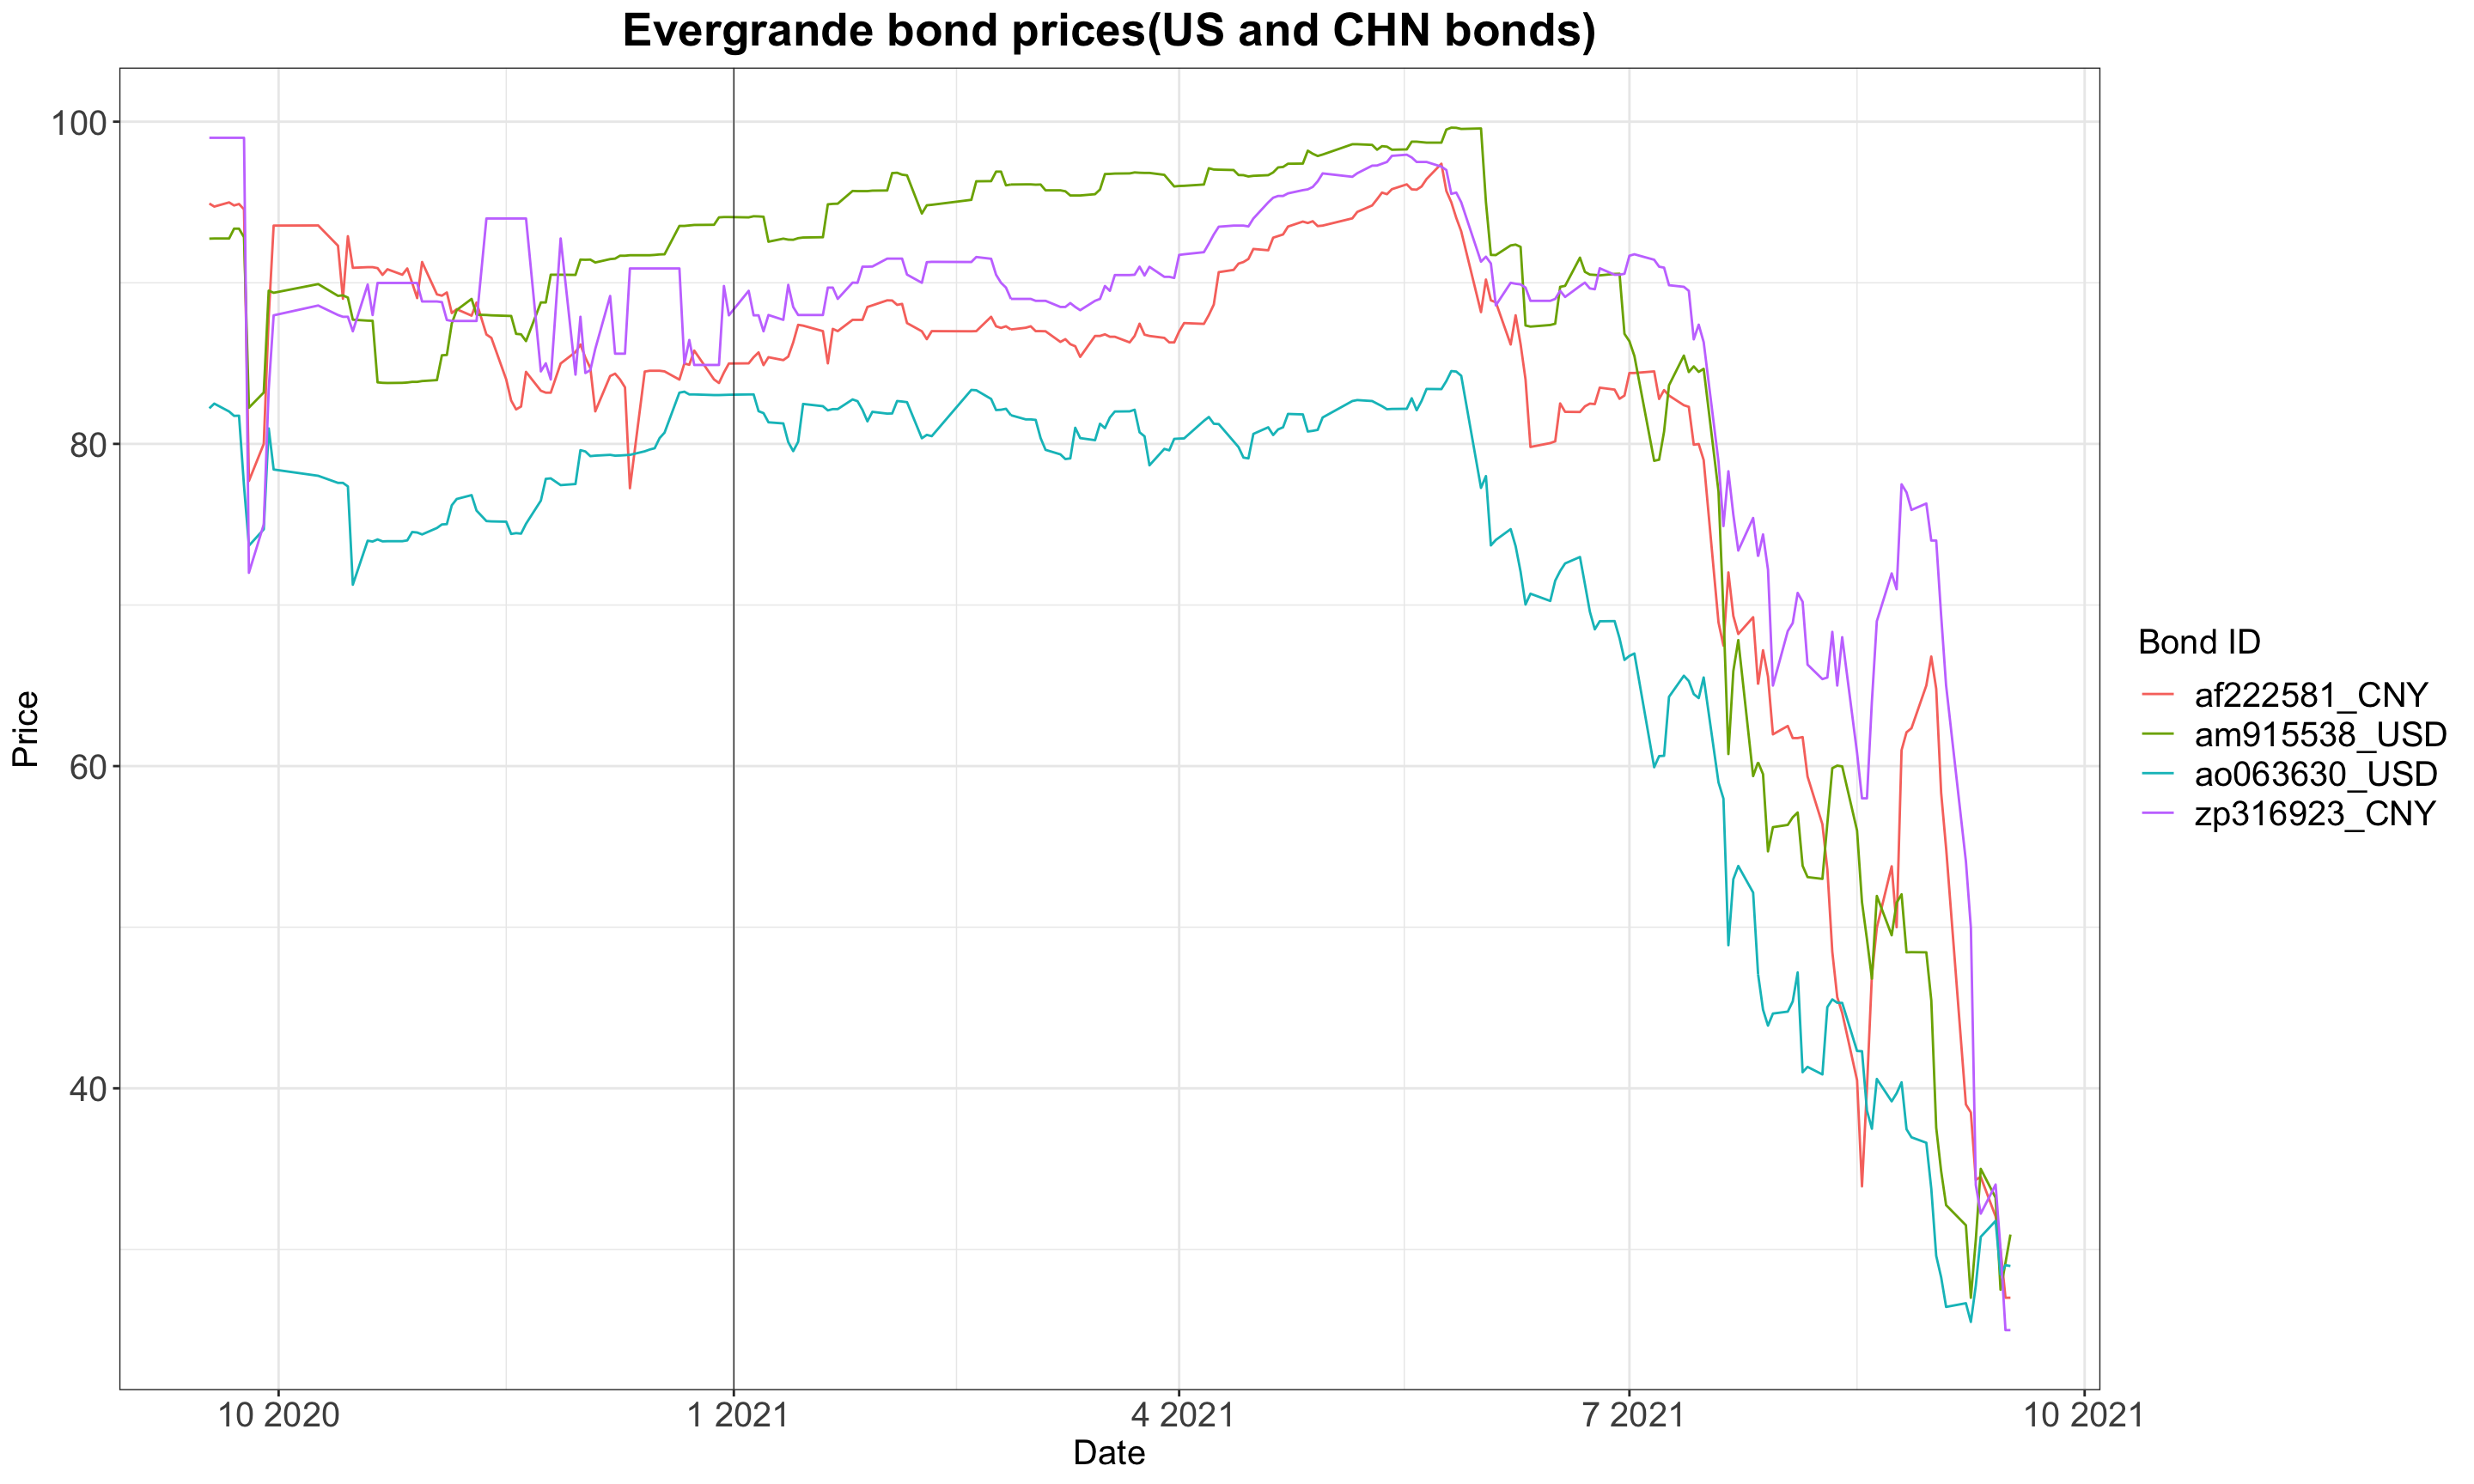
Fragile credit conditions soon translated into credit choke towards Chinese companies having similar leverage issue as Evergrande does. Meanwhile, Chinese state government has also shown its strong determination on achieving its goal of common prosperity and its cautions on disorderly capital expansion through ruthless intervention starting from last year on Ant Group’s IPO, unexpected supervision on Didi and other renowned tech companies that finished their US IPOs just few days before, and sudden crackdown on the after-school education industry. These actions caused turmoil among foreign investors in China and some of those with longstanding business in China fled out and directors from several hedge funds came out wo send warnings about investing in this world second-largest economy. There is no doubt that the growth is no longer the priority of the government this year given the strong performance in the first two quarters and it is going to use this window to implement its cross-cycle adjustments regarding structural changes on country’s economics.
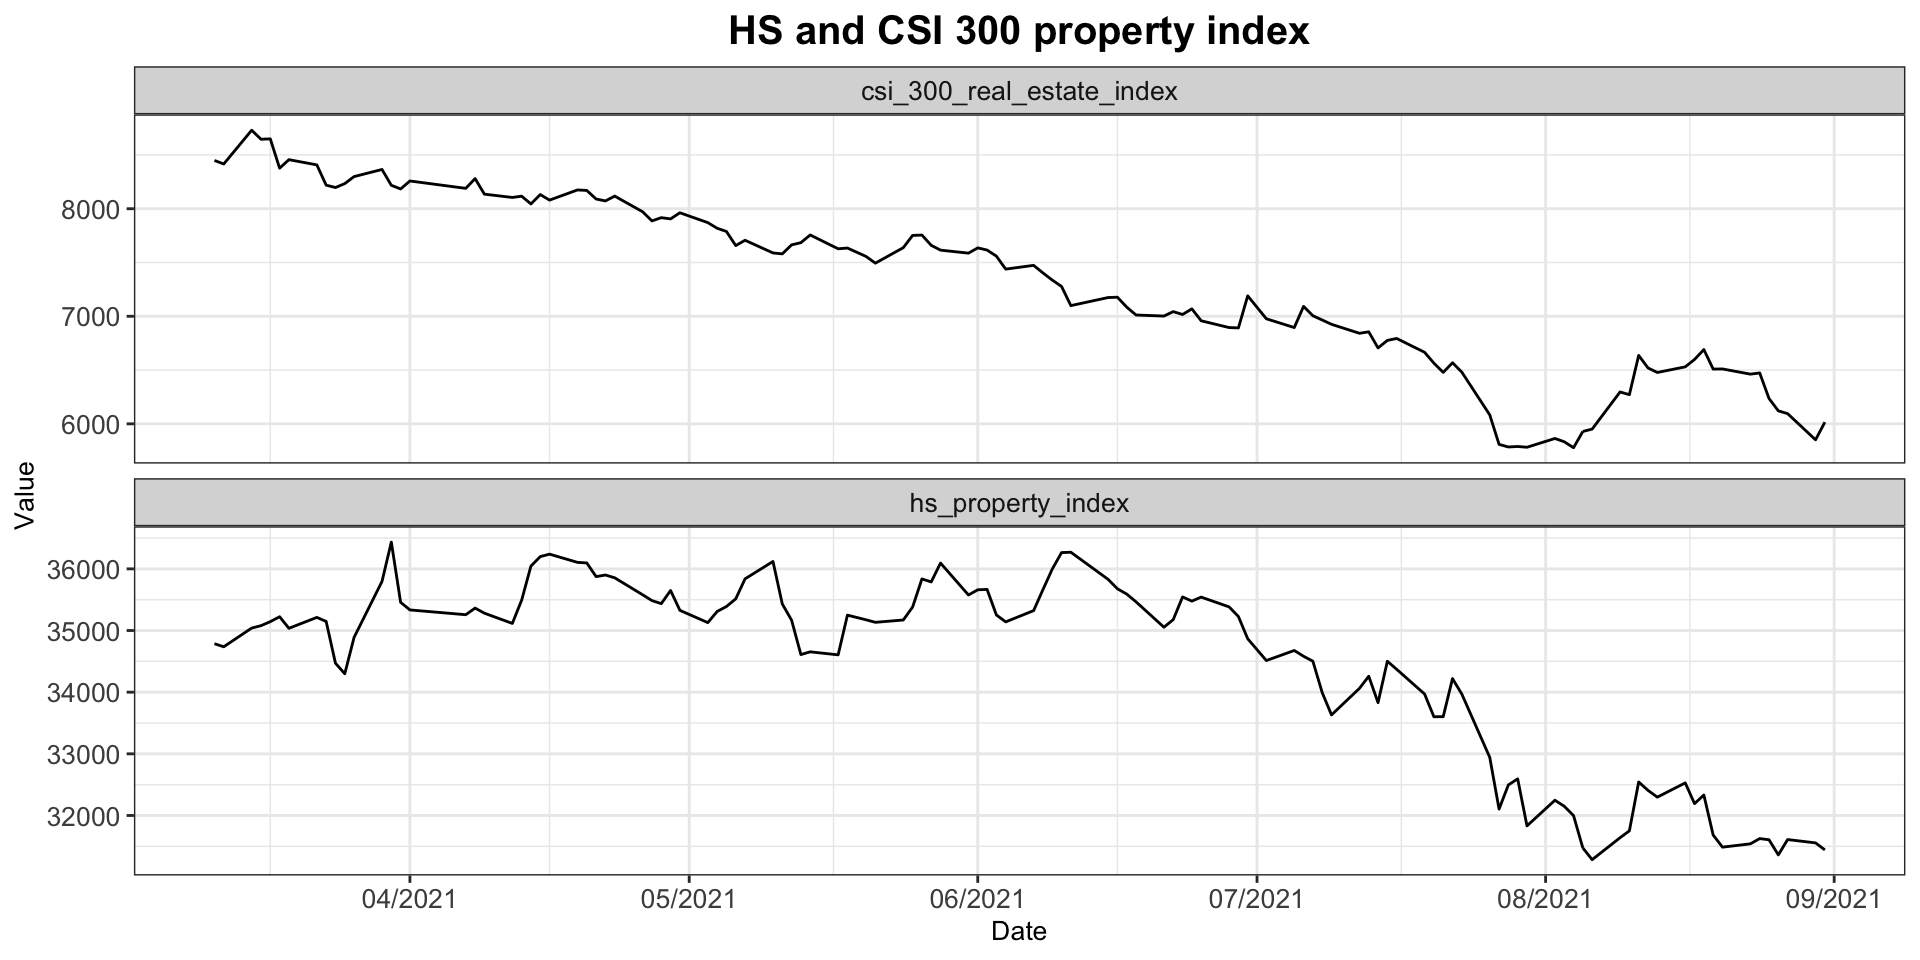
The graph above compares the price performance of two high yield bonds index that represent C rated US-dollar bonds of US companies and China companies respectively. High yield bonds should have performed well in this environment with adequate liquidity and low treasury 10-year yield. US high yield markets recorded historical sales this year and high yield index also rose to a 3-years high in a risk-on environment, letting many bond fund managers to suggest that investors should put money into the equity market because the credit market is boring because of the distortion from the FED. 10-year treasury climbed in the first half of year to 1.7% before fell to 1.3% even the inflation turned out to be not that transitory and the economy growth expectation was running hot. It’s not hard to see from this graph that Evergrande crisis is affecting the sentiment towards risky Chinese companies as a whole. The decrease was more obvious from July and it was also the month in which one of the China local banks asked the local court to frozen Evergrande’s assets due to miss payments of loans. The completely different picture of high yield bonds for two huge economy implicates their different priorities and strategies next step. The effects will persist for a while and no one knows how worse it has to be further. All in all, these analysis show that the risks are high and the problem has the propensity to flow over to other sectors. Therefore, Evergrande’s situation would be watched meticulously and investors would make choices based on how this company would try to save itself.
This could also be proved from Hang Seng property index and CSI 300 real estate index performances:
Credit pain
The real estate sector is bleeding and so is the economy. There is no secret that China’s growth have long been driven by the prosperity of its real estate industry, especially after pouring trillions of investments into economy by the central government after GFC. It absorbs a large share of fixed asset investment which accounts for roughly 70% of China annual GDP and it also represents majority of non-current assets and debts on the family balance sheet, enjoying a huge impact on consumer confidence and rent costs of tertiary sector. In a word, structural changes of the growth engine will cost and it surely costs a lot. Billions yuan of loans have been given to estate developers for developing and constructing their projects and debts, and families also borrow huge amounts of money from the bank as mortgages.
Loan growth is key to support the gdp growth because one’s consumption is another one’s revenue. When economy is running hot, confidence is high and thus companies are willing to increase their CapEx and consumers are willing to purchase by using their future income. Therefore, the economy prospect in return is reinforced and performs even better. This could be depicted by YoY growth graphs of gdp and loan, and I also found out that loan growth YoY has a leading explanatory effect on gdp growth YoY about 3-quarters.
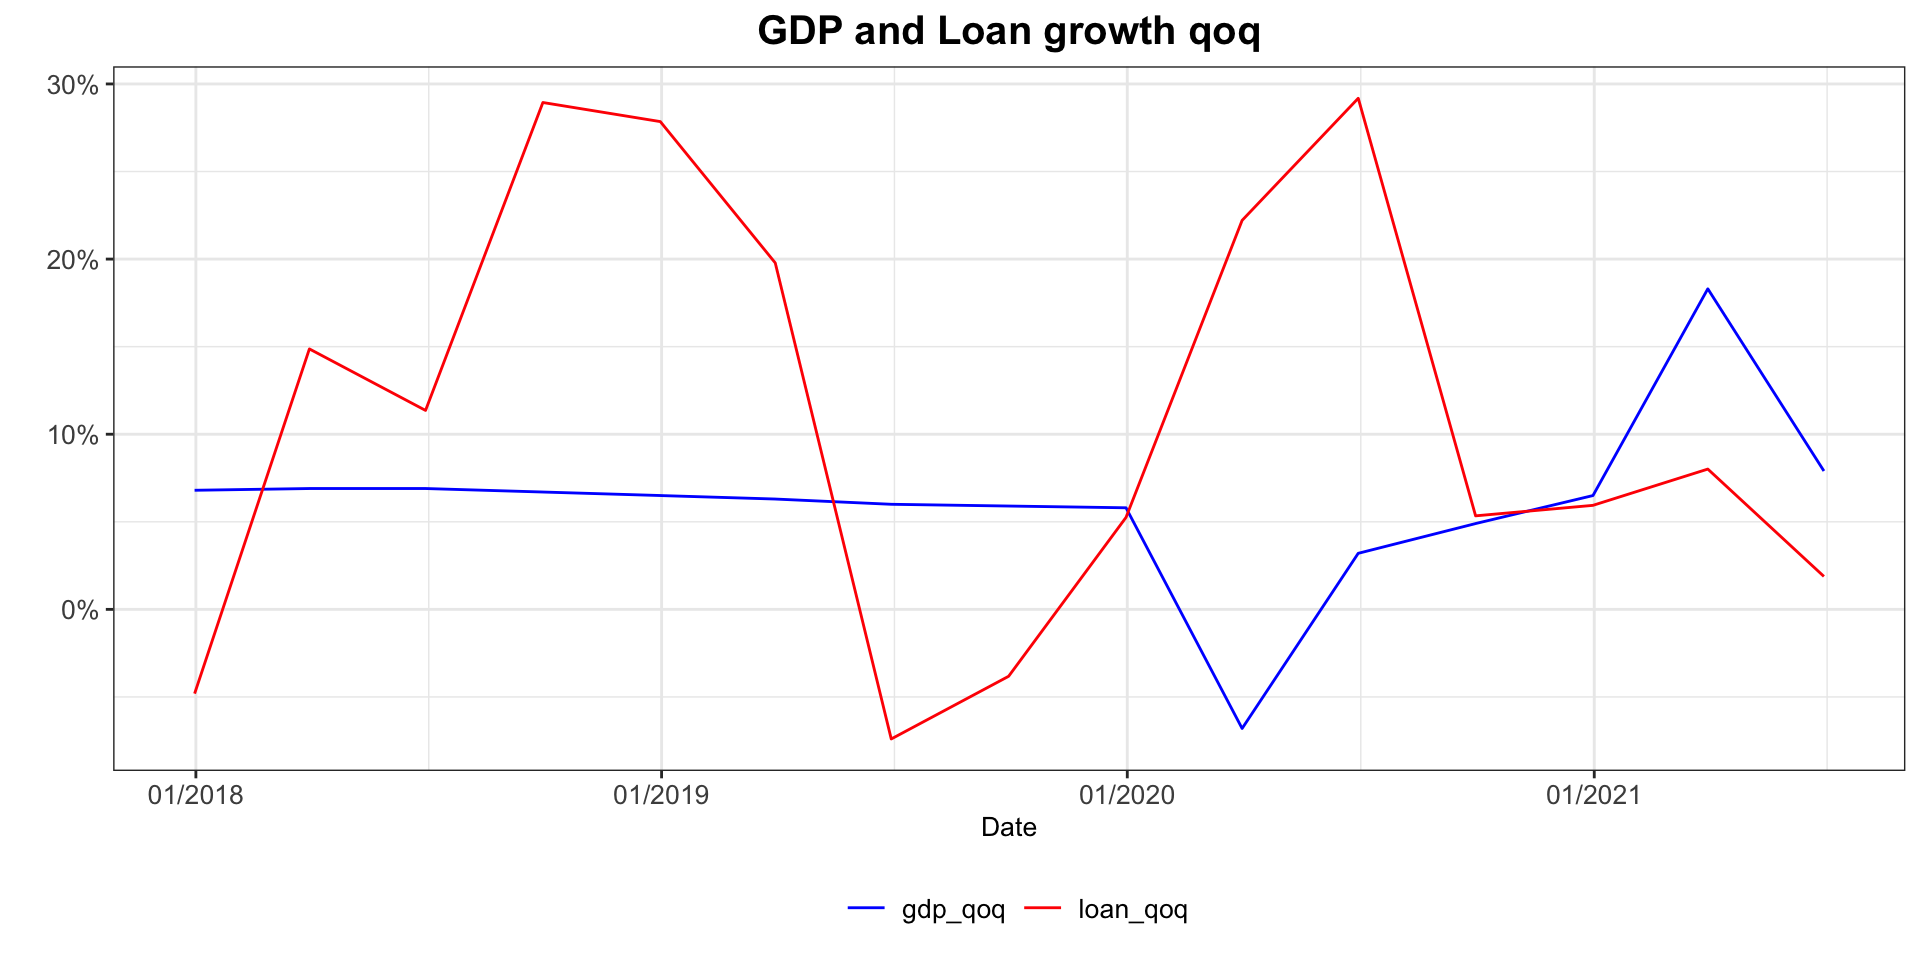
Correlation test on loan and gdp growth qoq rate:
##
##  Pearson's product-moment correlation
##
## data:  x and y
## t = 2.2, df = 13, p-value = 0.05
## alternative hypothesis: true correlation is not equal to 0
## 95 percent confidence interval:
##  0.008326 0.814384
## sample estimates:
##    cor
## 0.5184
Hence, since the latest quarterly loan growth data shows a apparent slowdown, China GDP growth of the second half and even of the next year will be under great pressure when country’s export won’t be as strong as this year because of the substitution effect of global reopening which means some countries in Southeastern Asia will take away part of exports. Besides, the normalization of developed countries fiscal policy also means that consumers demand in these regions will gradually fade away.
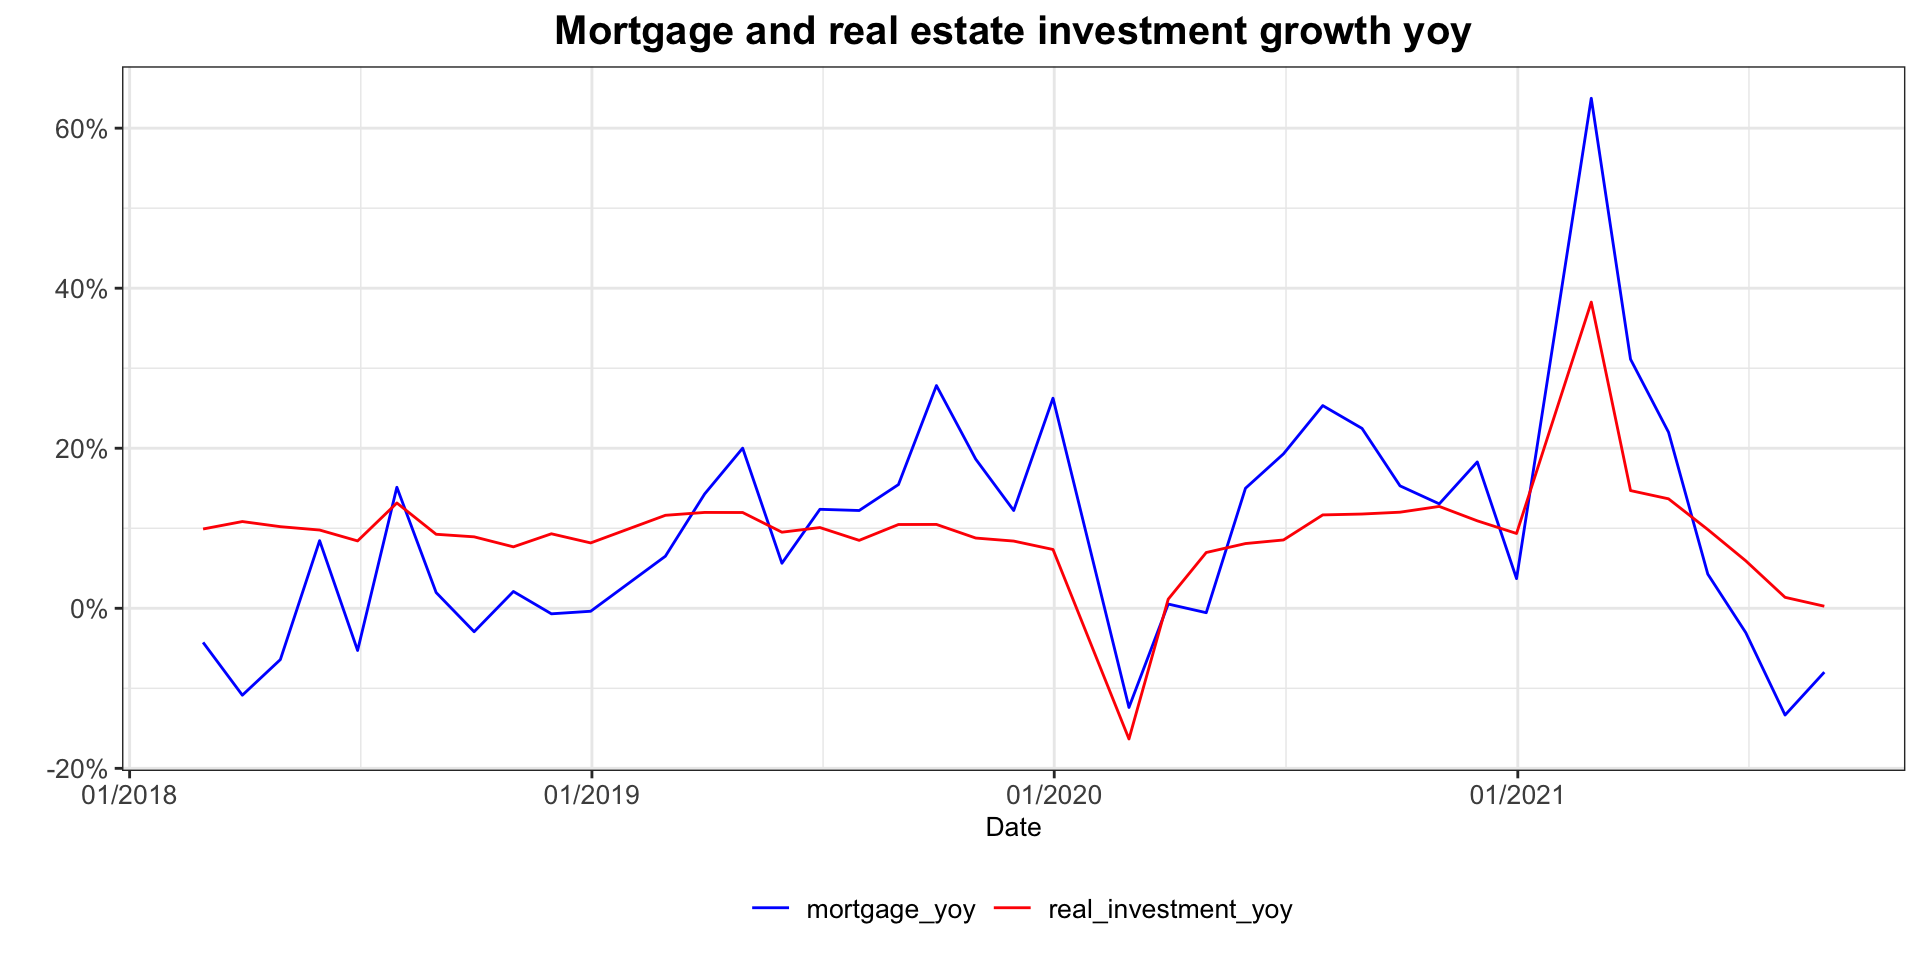
Besides, apart from the relationship between GDP and loan, a similar one could also be observed from the relationship between the mortgage and real estate sector investment. As discussed before, fixed asset investment comprises of a large part of real estate investment. Consequently, if real estate investment growth starts to decline, China GDP would eventually return to its potential growth rate. I made a graph and did a correlation test to support this argument as well.
##
##  Pearson's product-moment correlation
##
## data:  x and y
## t = 6.7, df = 38, p-value = 7e-08
## alternative hypothesis: true correlation is not equal to 0
## 95 percent confidence interval:
##  0.5475 0.8509
## sample estimates:
##    cor
## 0.7338
It also could be viewed from the relationship between mortgage and new construction rate:
##
##  Pearson's product-moment correlation
##
## data:  x and y
## t = 3.7, df = 38, p-value = 6e-04
## alternative hypothesis: true correlation is not equal to 0
## 95 percent confidence interval:
##  0.2476 0.7150
## sample estimates:
##    cor
## 0.5191
In short, this relationship is another self-reinforced cycle as it represents the demand and supply of the real estate industry. As you could see that same-direction decline at the end of last graph, transactions will be dragged down and this has been translated into the price collapse of commodity like Iron ore, hurting reflation trades as well. Although the credit environment is stretched, real estate developers still need to pay their debts and deliver returns to investors, and the only way for them to achieve this is by counting more on themselves. The next graph shows that the percentage of self-refund money in total property development investment continuously climb upwards compared with domestic loans from year to date.
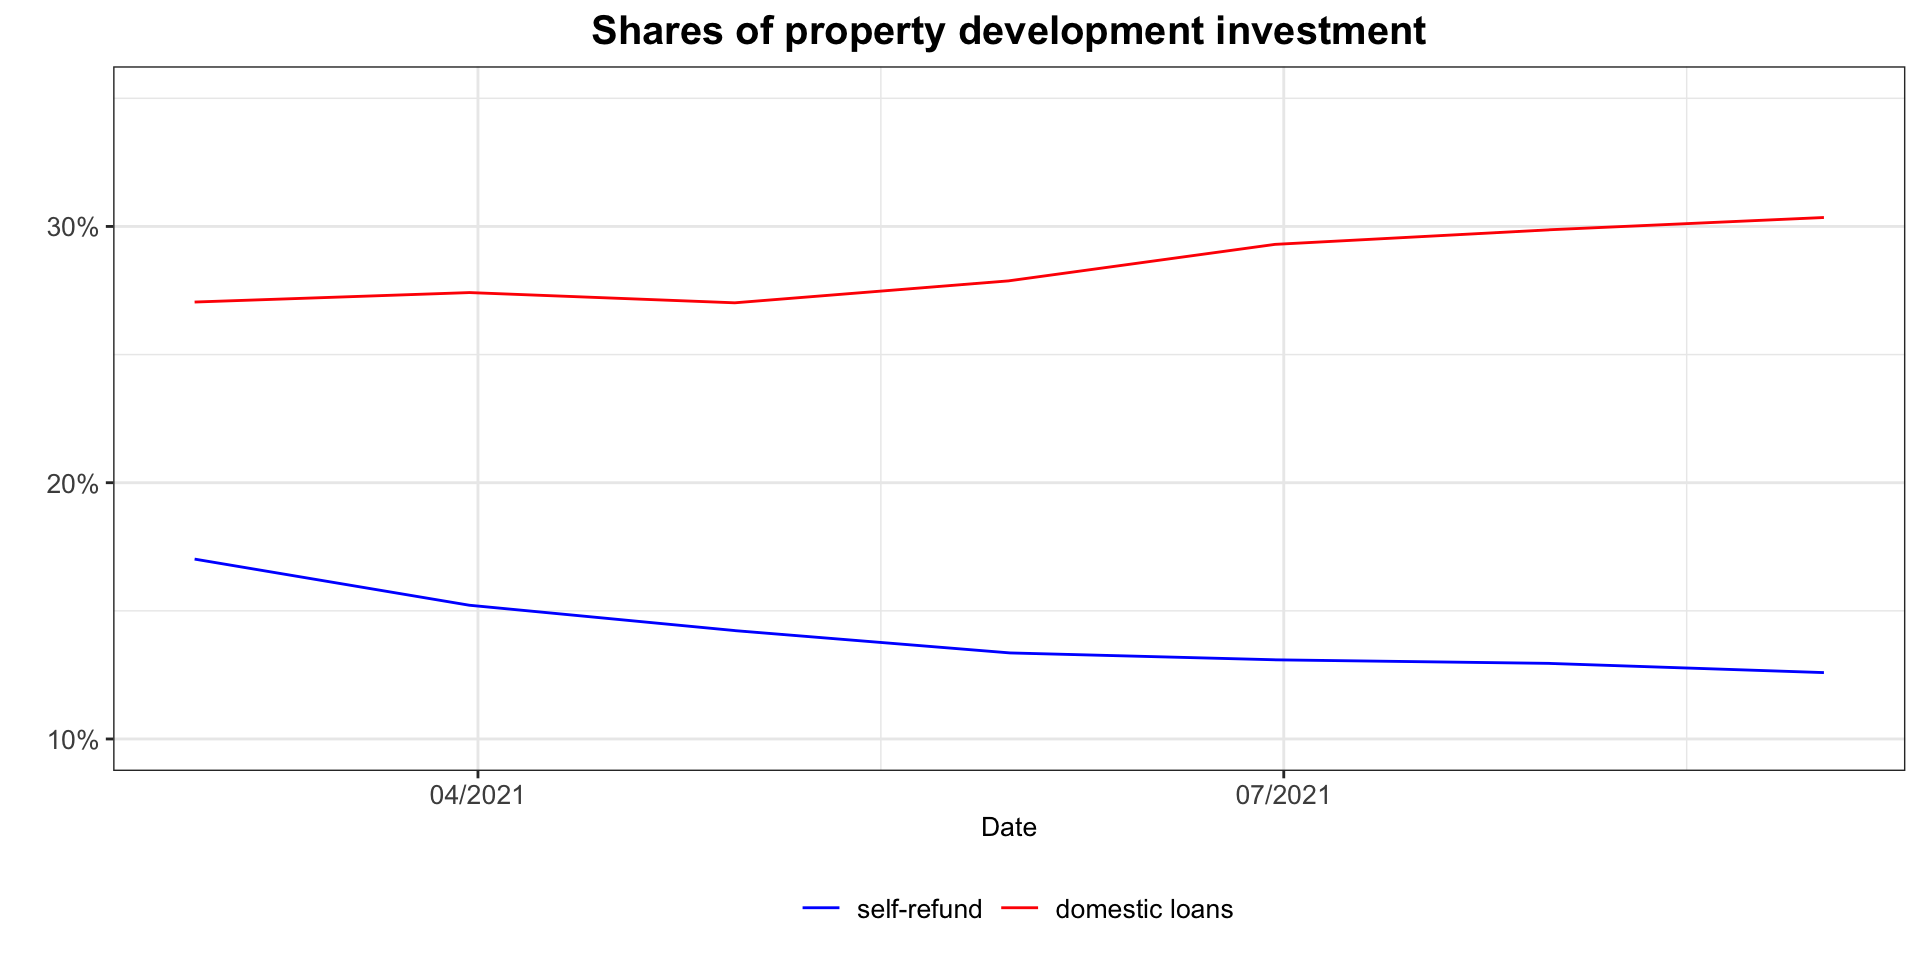
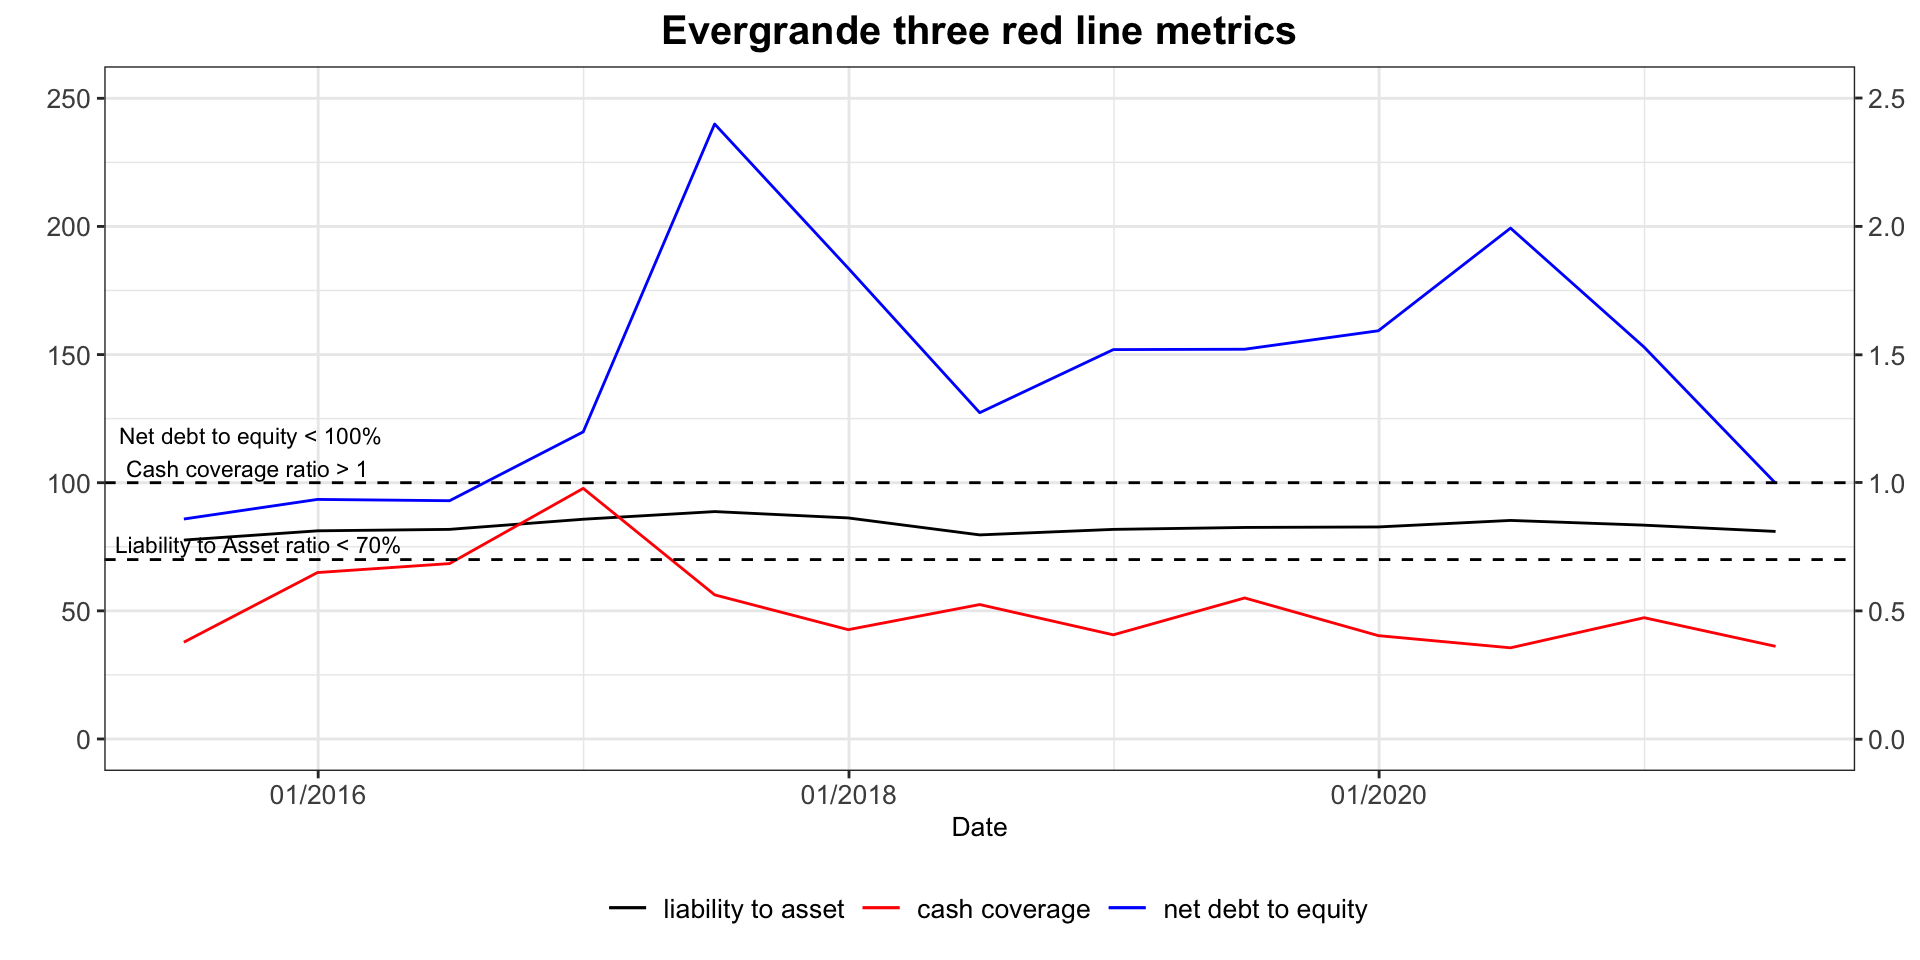
In August 2020, PBOC announced its “three red line” policy aiming at deleveraging the most indebted real estate developers and restricting banks lending preference to this problematic sector, marking its determination of rebuilding country’s economy structure. Three red line metrics include liability to asset ratio after deducting deposit received should below 70%, net debt to equity ratio should below 100% and cash coverage ratio should above 1. A developer’s borrowing growth rate is 0%, 5%, 10% and 15% separately depending on how many metrics it succeeds to meet. Unfortunately, according to the latest quarter report published by Evergrande, it merely satisfies one metric of making its net debt to equity ratio to 99.8% after a year’s discounted sales to get its cash back and the other two metrics couldn’t be seen how it could achieve given its poor cash status.
Sales, sales and sales
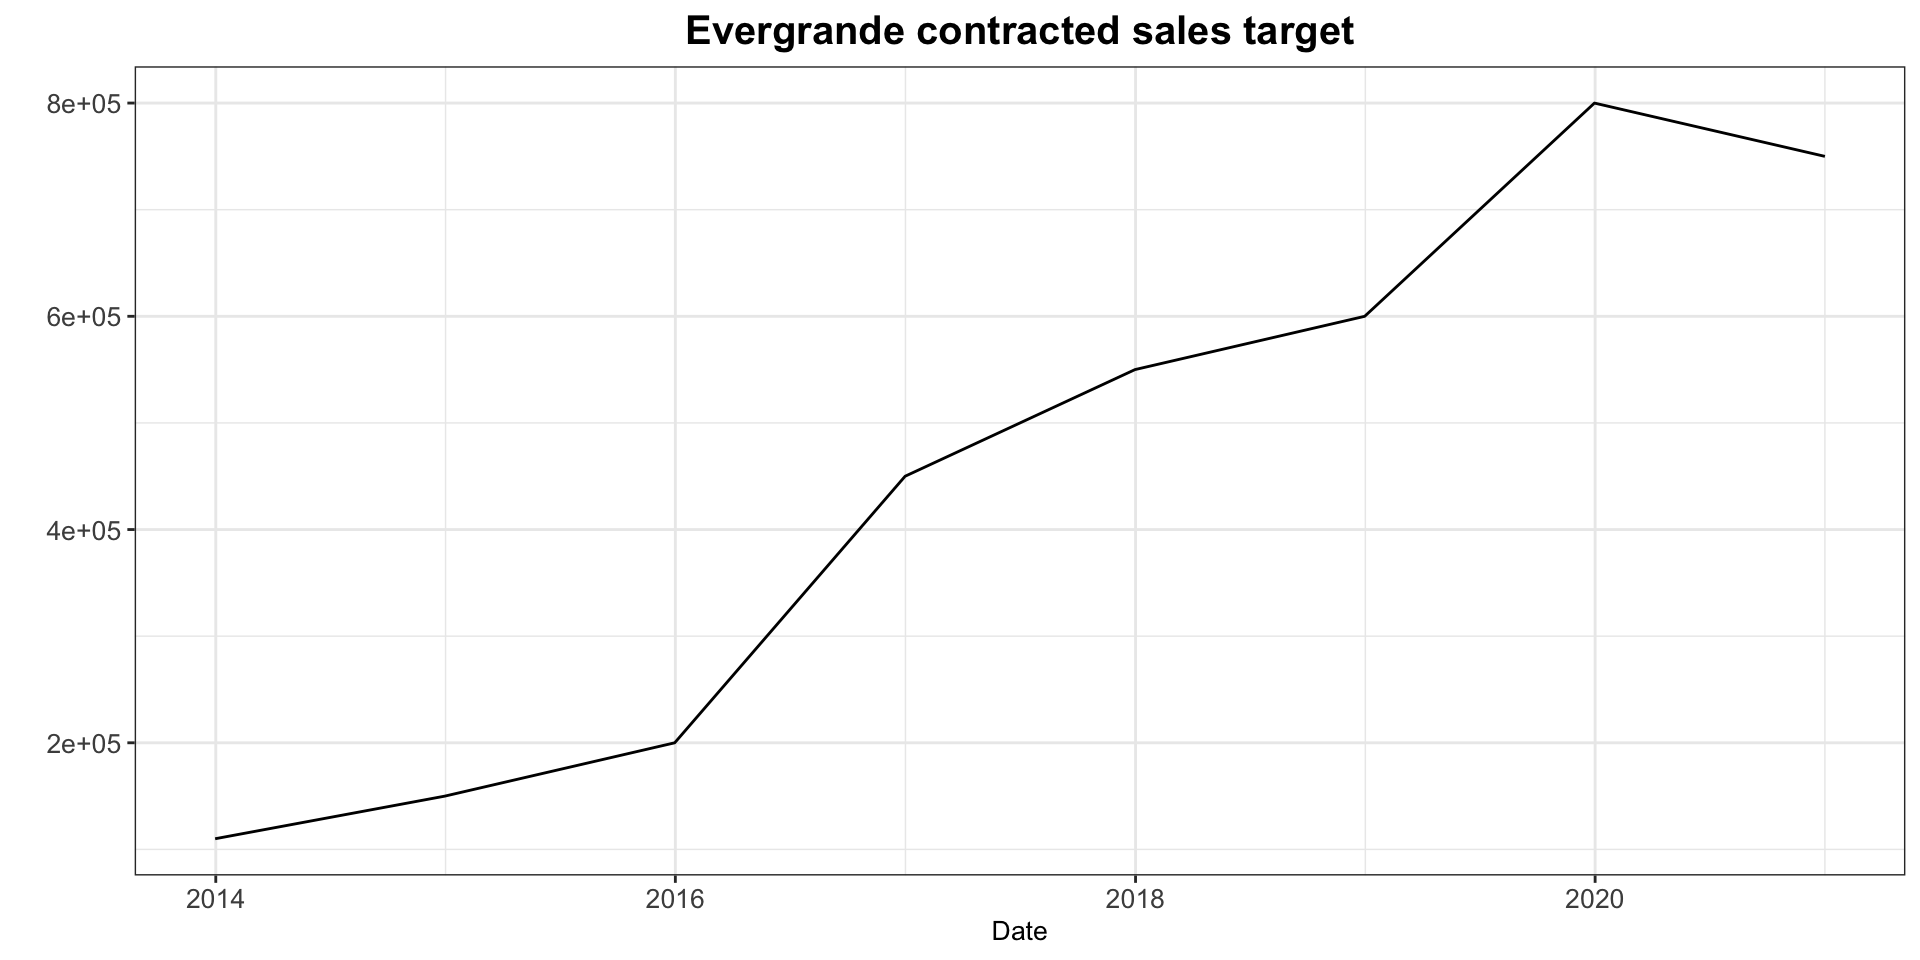
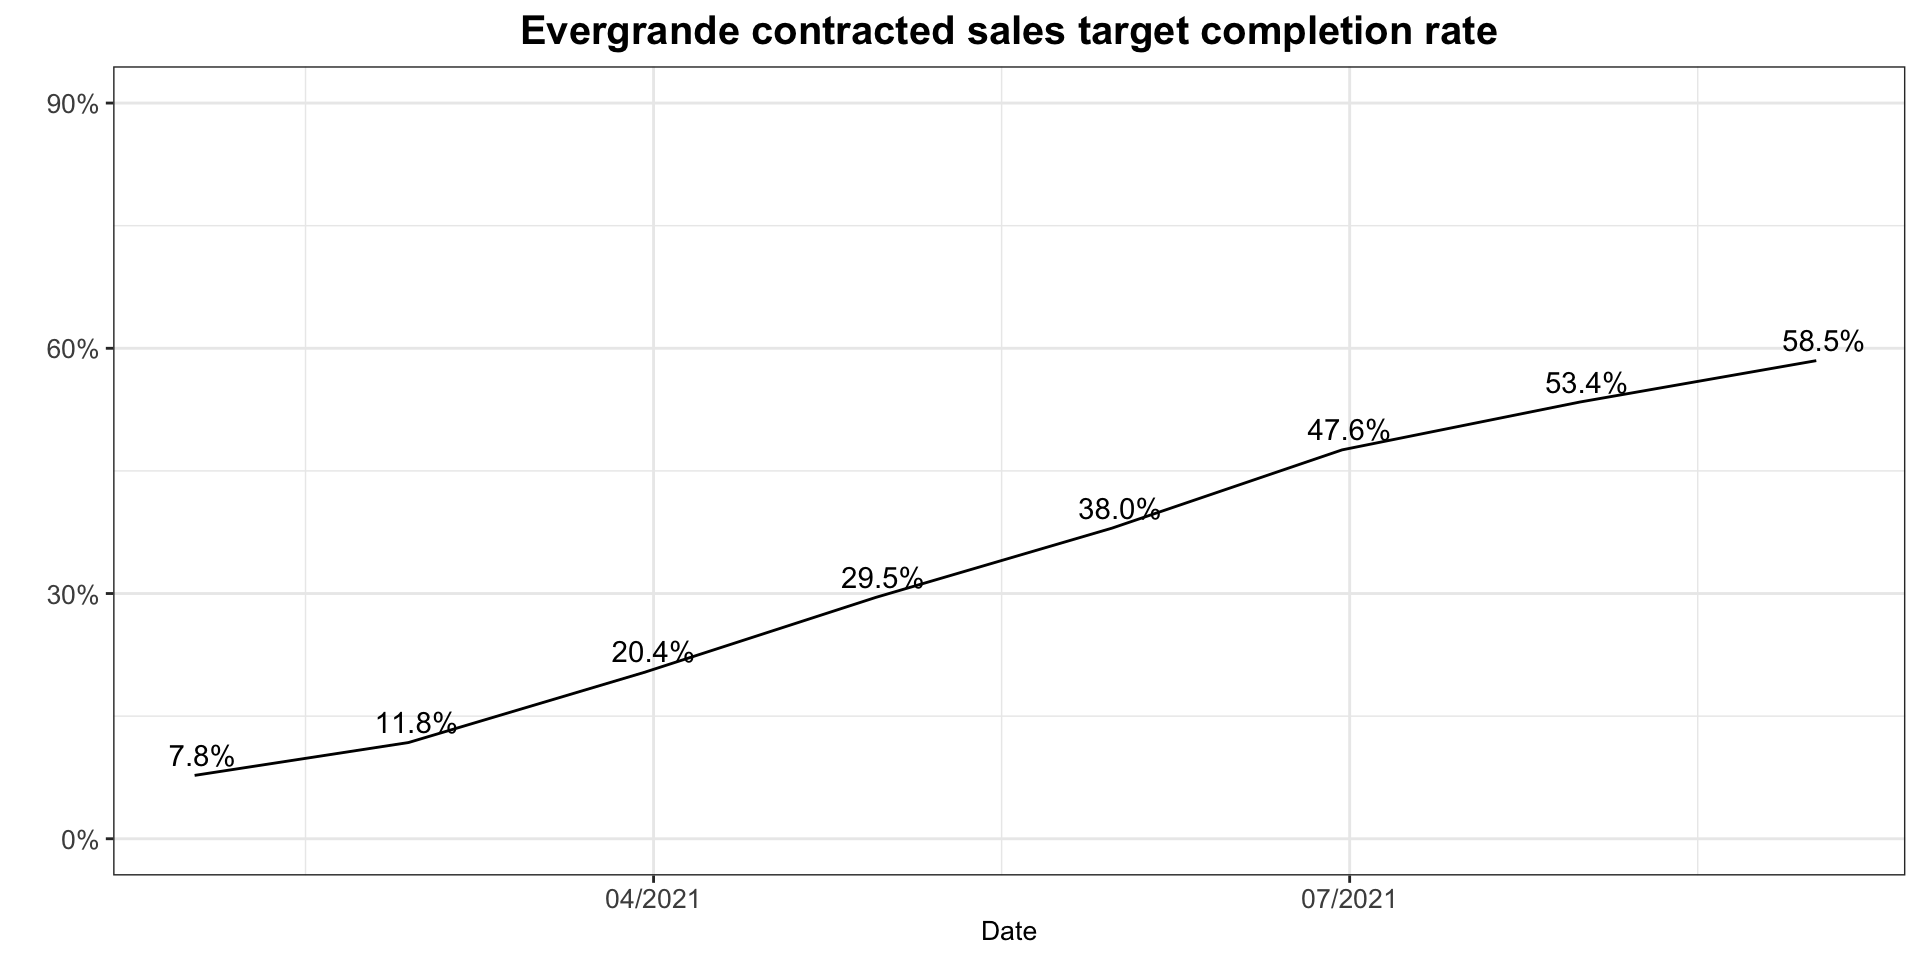
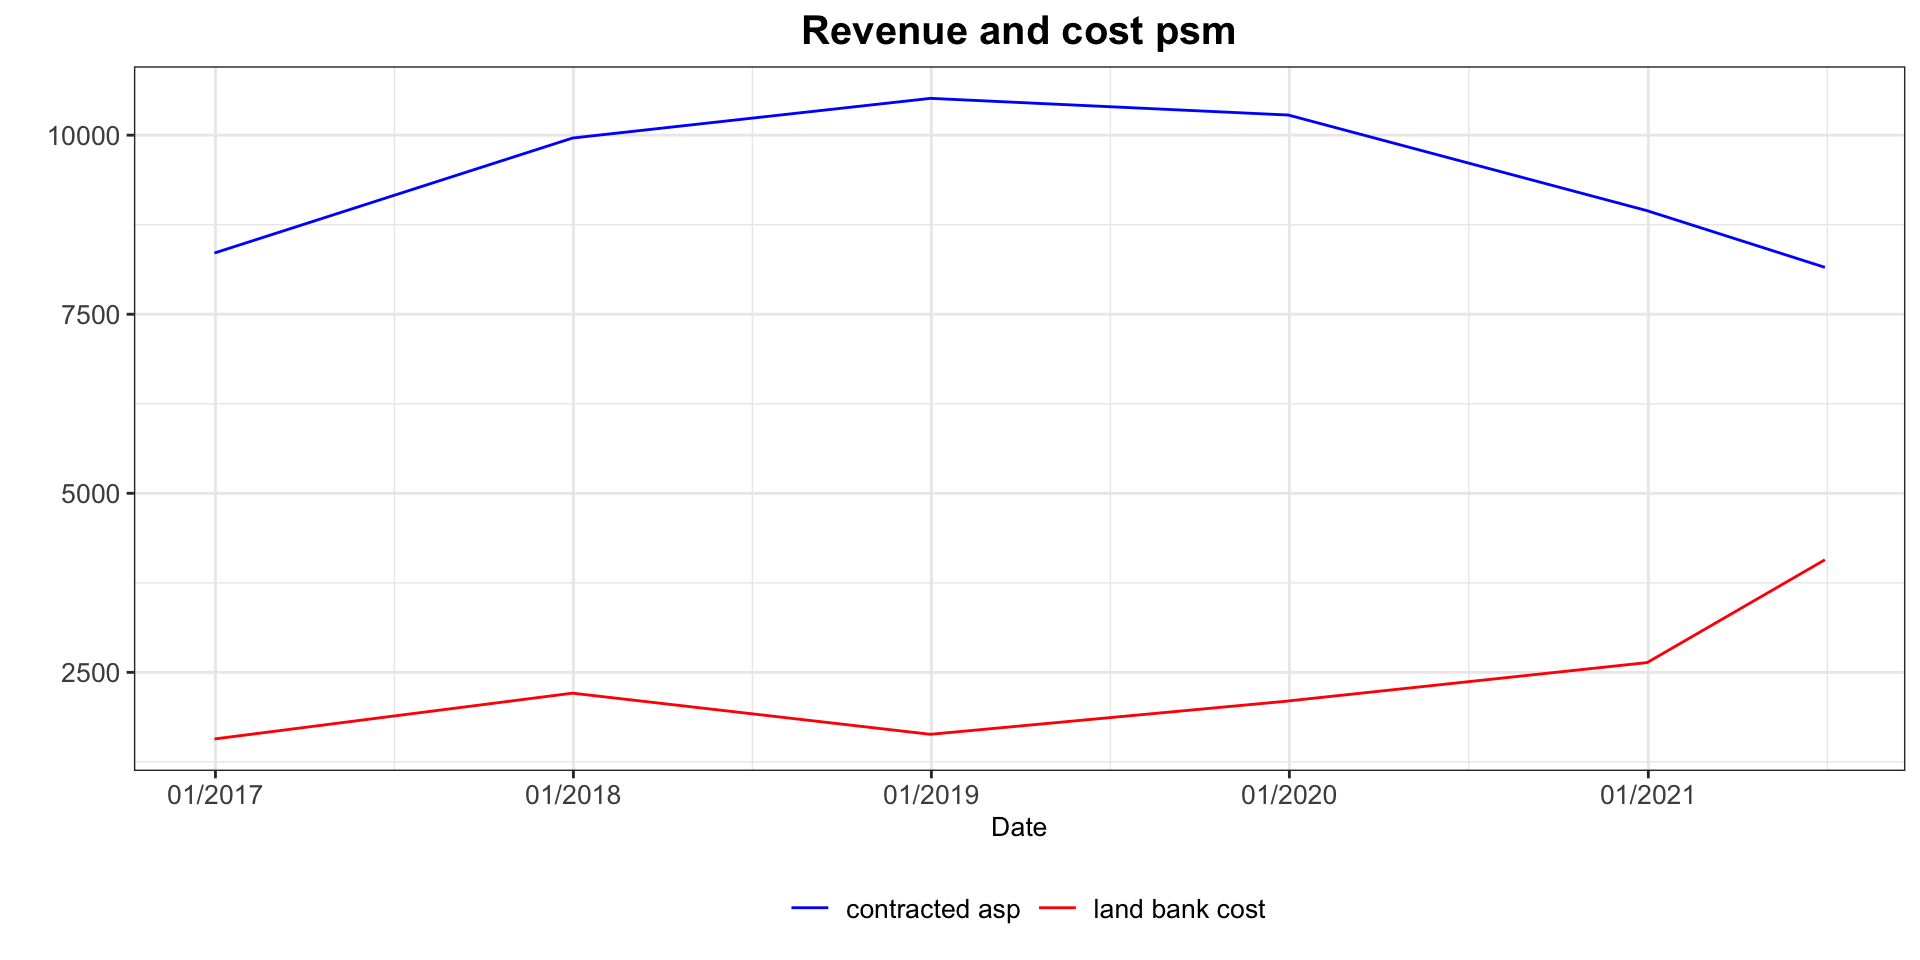
Evergrande is selling properties at full speed to meet the regulation requirements. Problems will only get worse if the company doesn’t have access to refinance its debts. Therefore, Evergrande makes an ambitious 750 billions yuan contracted sales target and according to the management team, everything runs well until the outbreak of another wave of covid-19 in July and some of its lenders puts more pressure on it in the same month, before suppliers lose both patience and confidence in the company and refuse to continue properties construction. As a result, although Evergrande’s ASP is at near 7000 yuan per sqm in August, 57% lower than its peers average of 16681 yuan per sqm, its GFA and sales data still crunched about 47% in August to 38 bilions yuan of sales from 71 billions in June, making its margin look disappointed. The latest prediction of Evergrande’s september sales is only 5.3 billion. If this turns out to be true, it means that Evergrande only finished 59% of its sales target after three quarters’ efforts. Under such circumstances, it’s not hard to imagine that investors dash to sell off every Evergrande financial instruments they own.
Evergrande sales target and completion rate YTD:
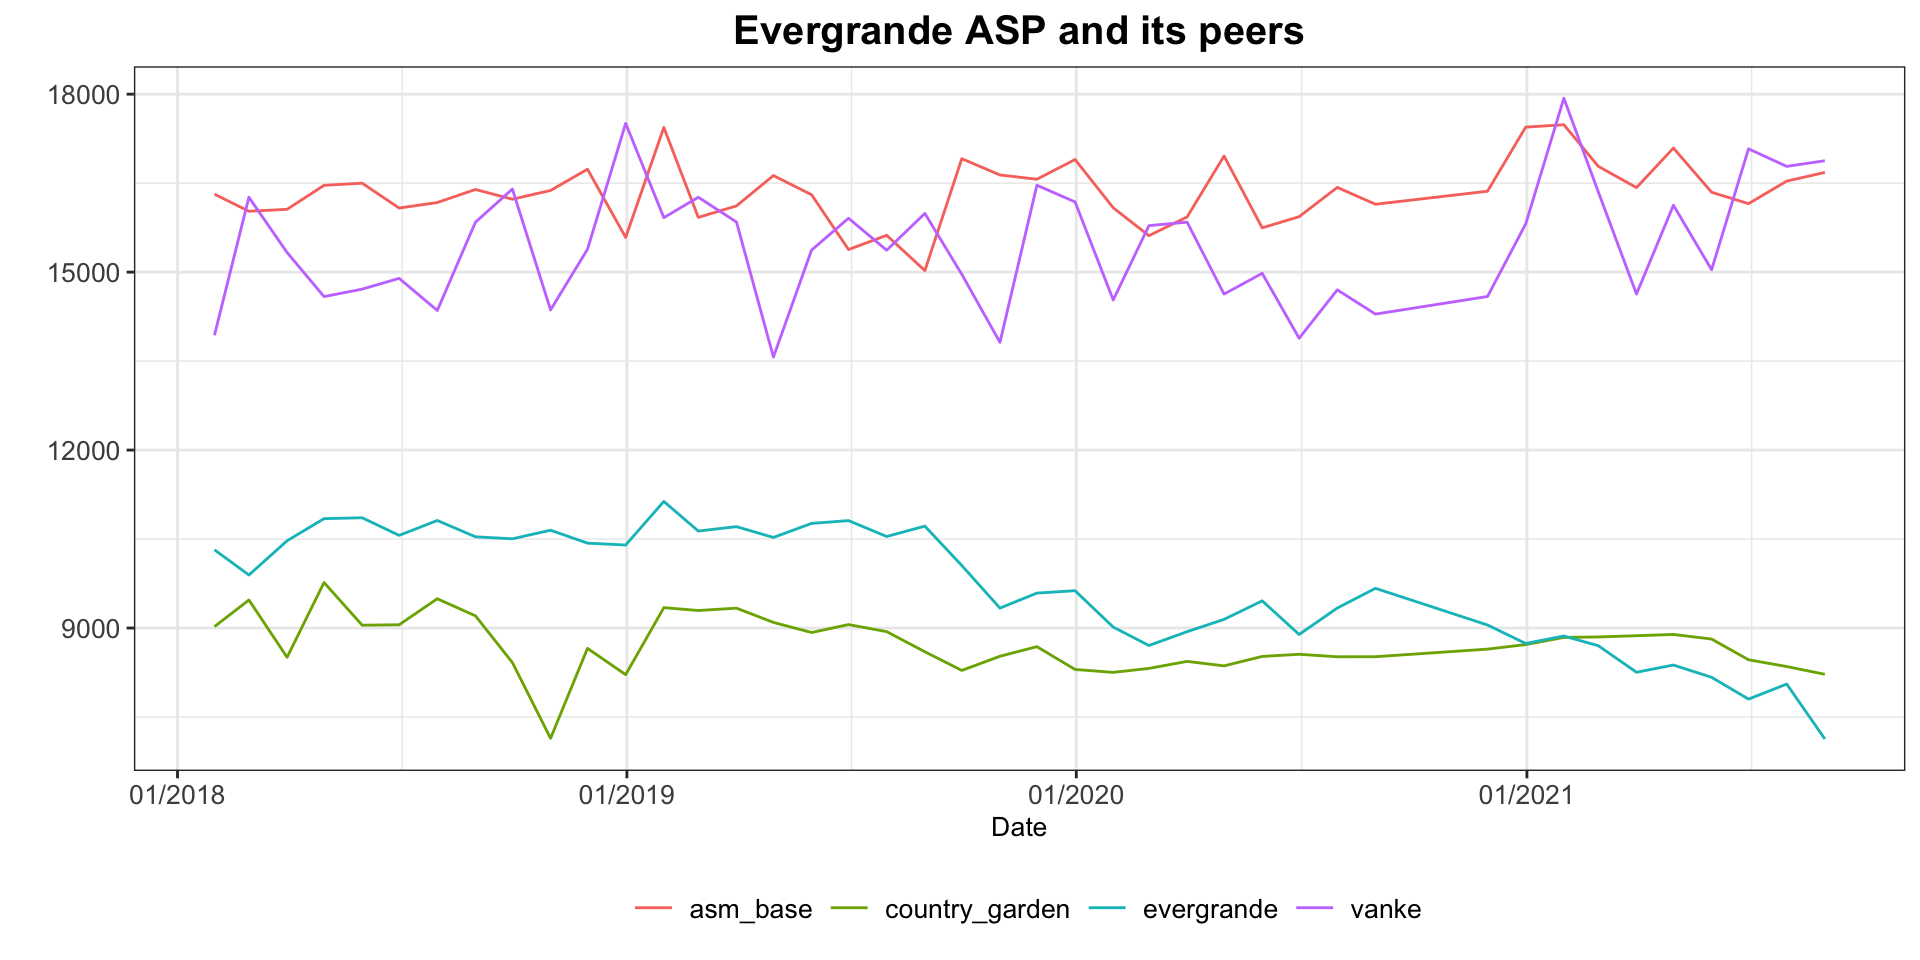
Evergrande and peers’ ASP :
Evergrande and peers’ sales performance YTD:
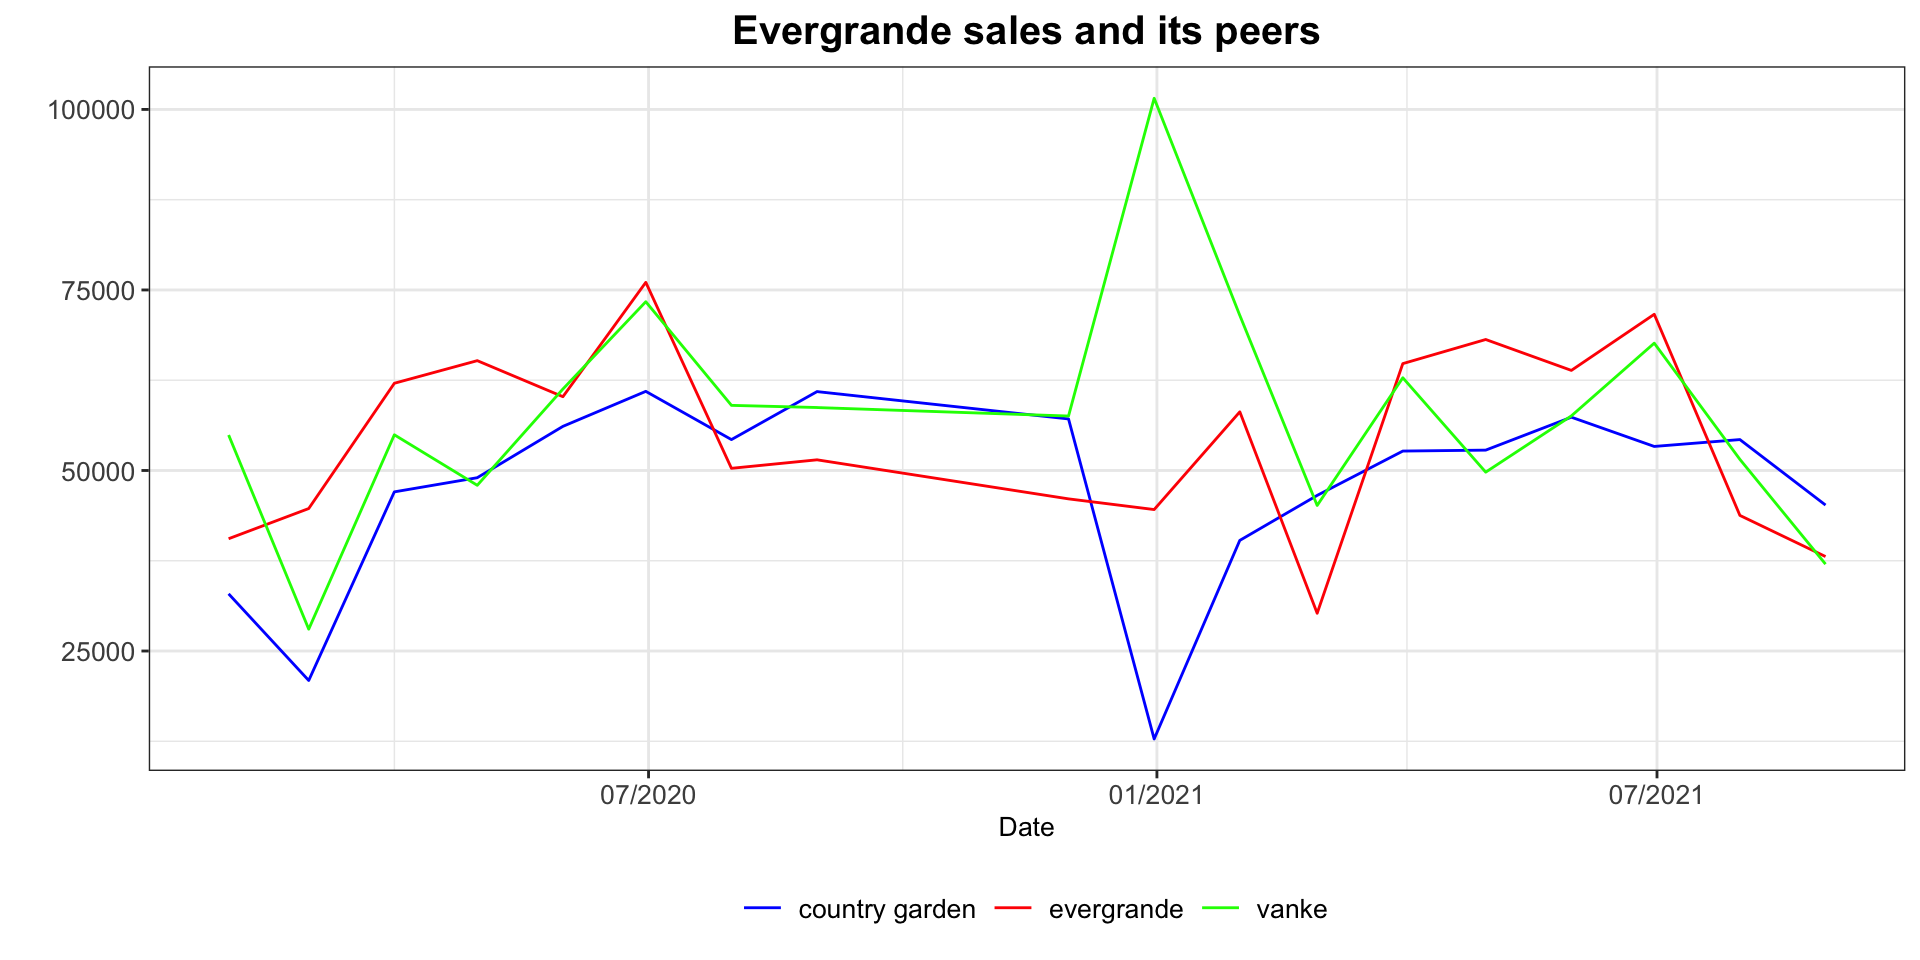
Evergrande is not the only developer who tries to sell fast, nearly all companies in the real estate sector are promoting remarkable sales volume as no one would know what would be included in the policy changes few months later. Every enterprise has to get more cash back onshore like what banks do when there is too much uncertainty and risks. The most active sales partners are private firms because generally they have a higher leverage ratio than state-owned developers, whole-industry property inventory shrink to record low and this could be proved by the surge of property ready to sale YoY growth rate and total sales YoY growth rate. However, new construction YoY and government land sales YoY growth rate is gloomy, representing pessimistic expectations for future business of developers. This is huge since the income comes from land transferring makes up the largest part of budgetary revenue of government-managed fund, which is more important for the local government because they don’t have a say on the taxation. With so many hidden liabilities in the form of city investment bonds, local regions without strong economy growth would have difficulty paying debts and spending on citizens’ livelihood.
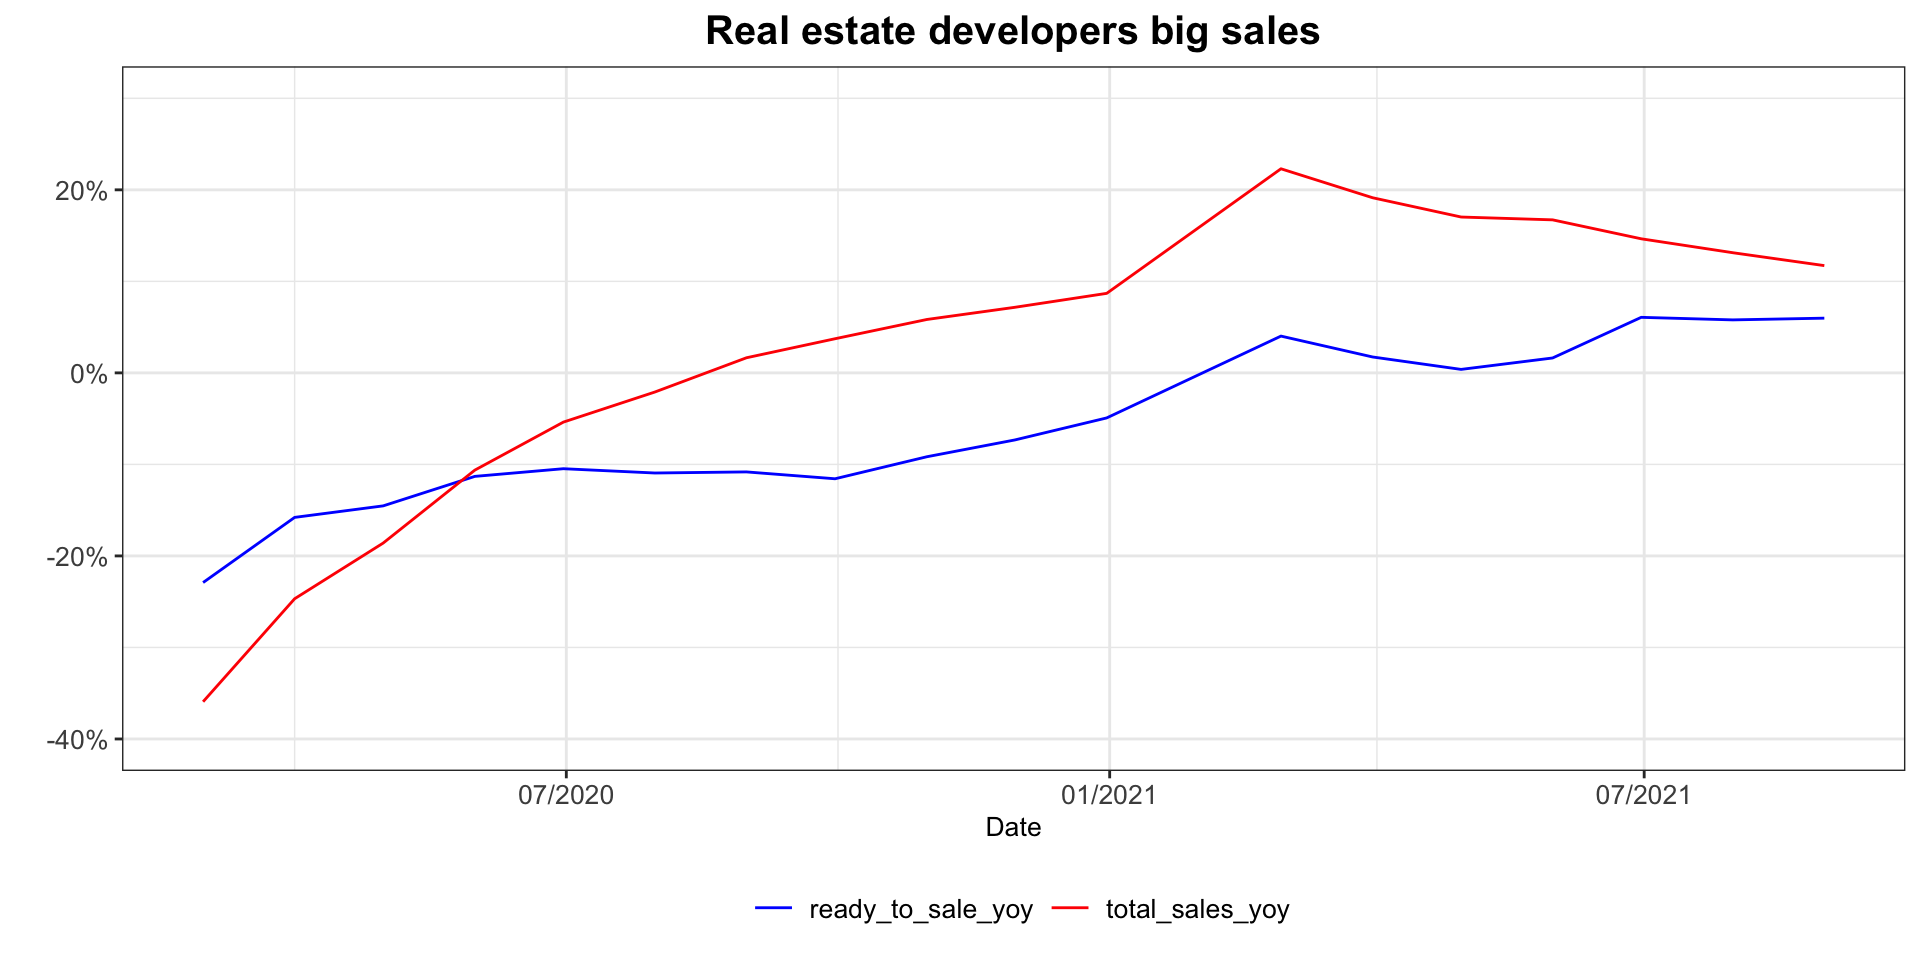
Lands transferring income and new properties construction volume have all fallen into the negative range:
## # A tibble: 40 × 5
##    date       mortgage_loans_… real_estate_inv… new_constructio… land_transfer_y…
##    <chr>                 <dbl>            <dbl>            <dbl>            <dbl>
##  1 2021/8/31           -0.0798           0.0026          -0.168           -0.0621
##  2 2021/7/31           -0.133            0.0137          -0.215           -0.0485
##  3 2021/6/30           -0.0305           0.0593          -0.038           -0.0566
##  4 2021/5/31            0.0427           0.0984          -0.0607          -0.205
##  5 2021/4/30            0.22             0.137           -0.0932          -0.292
##  6 2021/3/31            0.311            0.147            0.0725          -0.172
##  7 2021/2/28            0.637            0.383            0.643            0.143
##  8 2020/12/31           0.0371           0.0935           0.0633           0.174
##  9 2020/11/30           0.183            0.109            0.0412           0.161
## 10 2020/10/31           0.130            0.127            0.0352           0.148
## # … with 30 more rows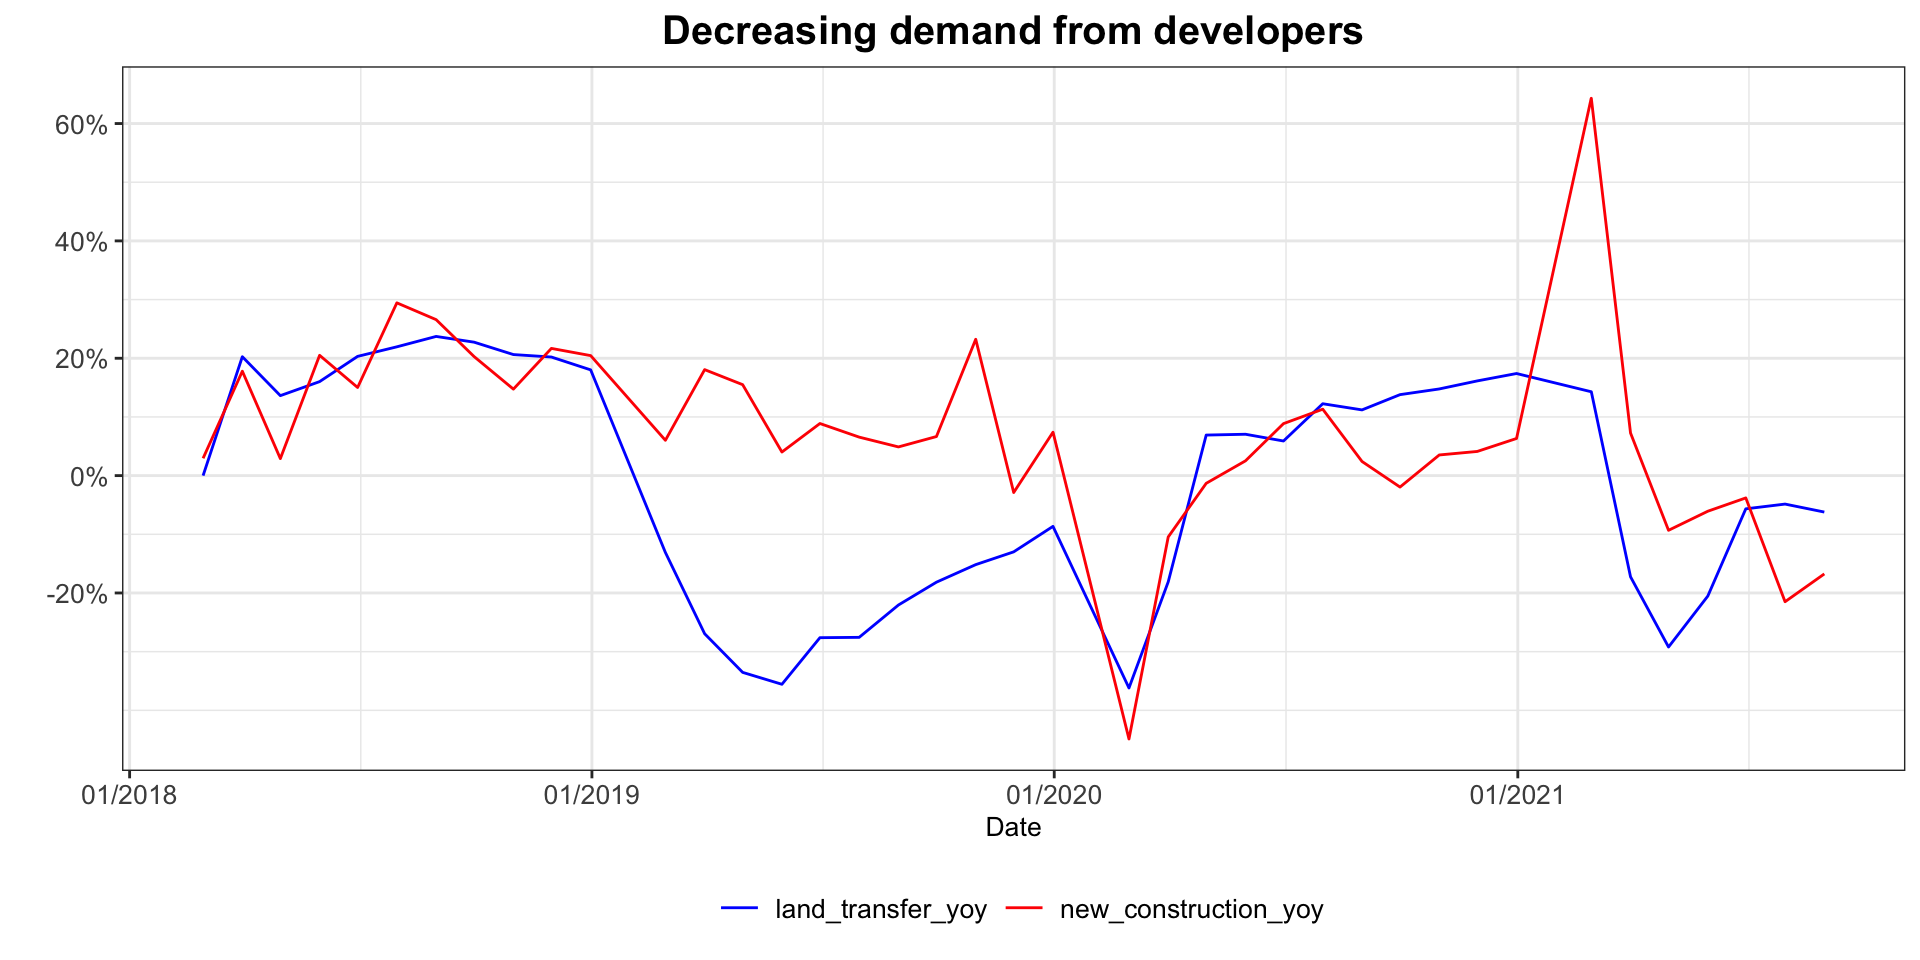
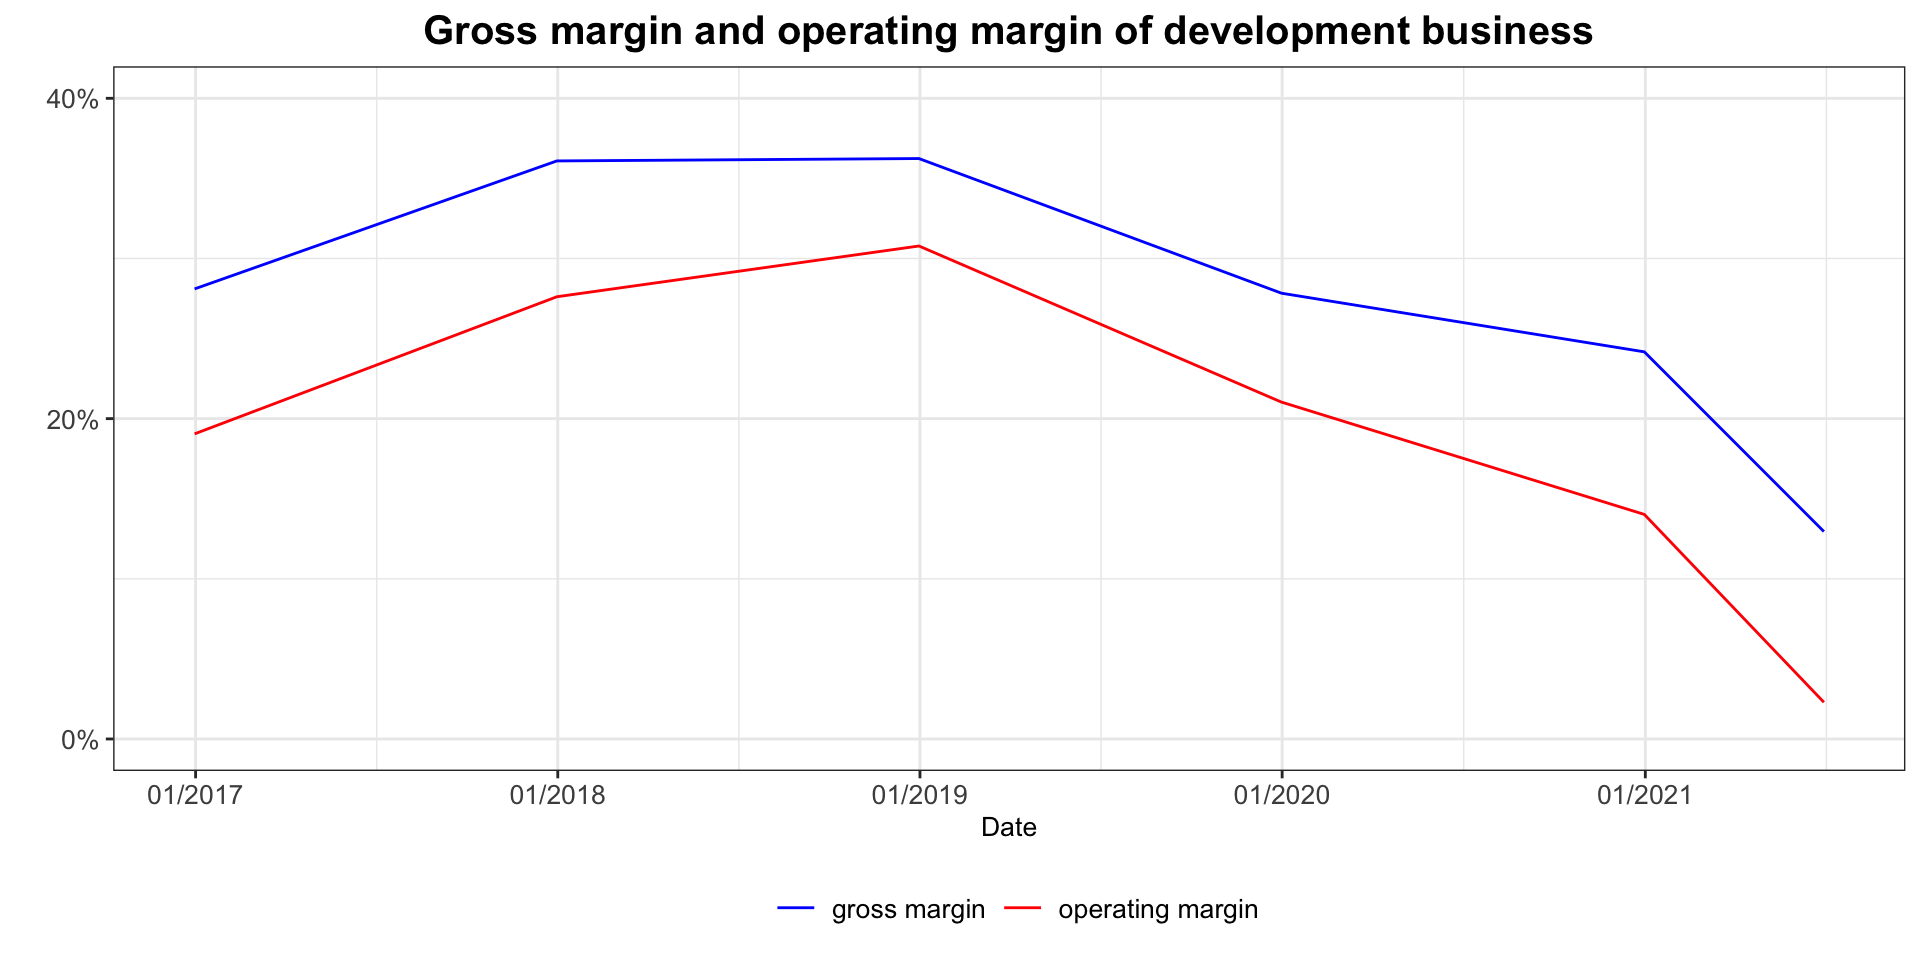
Poor sales and low prices combined hinder Evergrande’s efforts on bringing cash back into its balance sheet, aggravated by increasing construction costs and affiliated SG&A expenses considering the fact that more money will be spent on marketing sales discount. Hence, the margin nearly halves from last report’s figure and hits an all-time low since its IPO with gross margin of 12.95 percent and only 2.29 percent of its developing business operation margin.
Too big to fail?
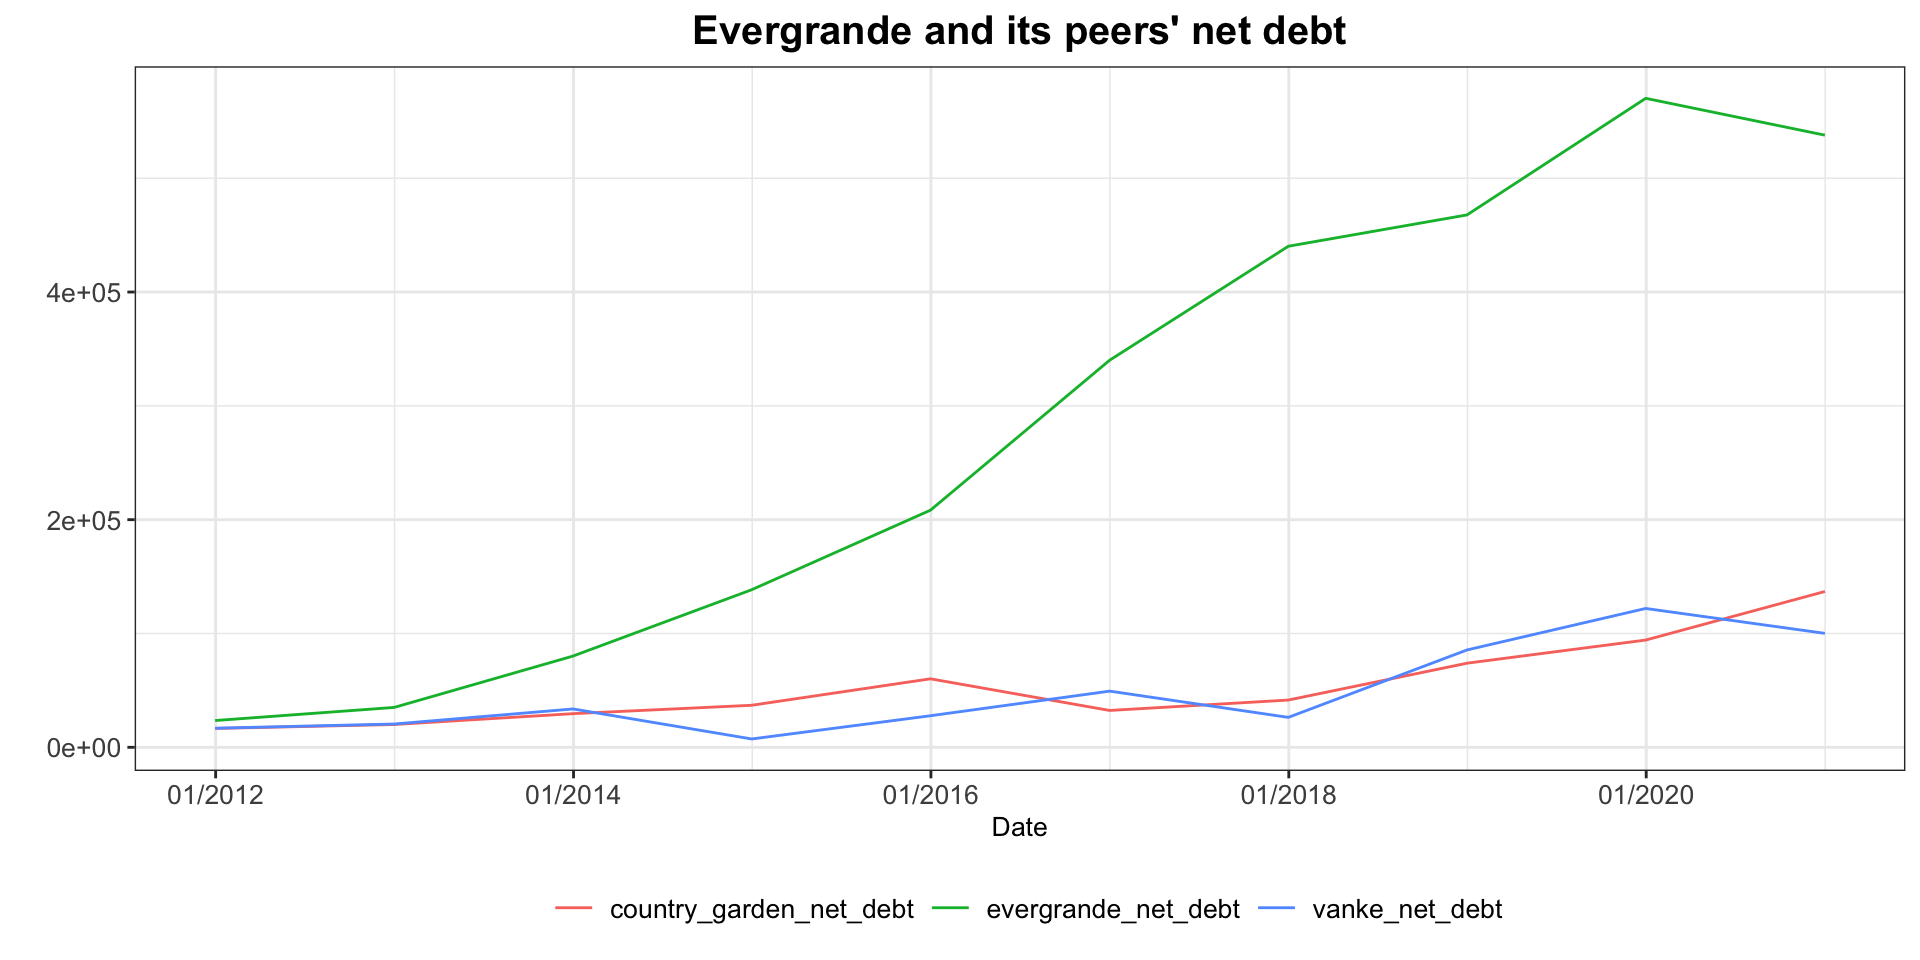
All these financial disadvantages force Evergrande fail to honor its interest payments responsibility even after it managed to repay principle and interest of all US-dollar dominated bonds matured in this year. This is not the first time Evergrande has caught market’s attention. Back in September last year, a letter from Evergrande to the guangdong provincial government was leaked to the public showing that the company was in desperate and needed assistance. At that time, some experts interpreted this letter as Evergrande’s strategy to persuade the government to open green light on its restructuring plan with Shenzhen Special Economic Zone Real Estate & Properties, which has already listed on the China A-stock market. However, the restructuring plan was aborted in the end after more than 1500 days of anxiety and frustration, and Evergrande lost its best opportunity to get a considerable amount of external refund after losing access to the credit market because of the failure of meeting any three red line metrics. According to the statistics provided by the bloomberg, Evergrande still had 669 million dollars of interests required to be paid before the end of this year. It’s not an unreachable number considering Evergrande still has 153 billions yuan of cash equivalent on its balance sheet and has raised 14.3 billions yuan through asset disposal. However, the real problem is that Evergrande has an enormous amount of net debt which means the due date will just come consecutively and it has more liabilities to its suppliers and contractors.
Evergrande net debt is significantly higher than two large renowned developers:
However, it’s cash and cash equivalents situation is the poorest among three;
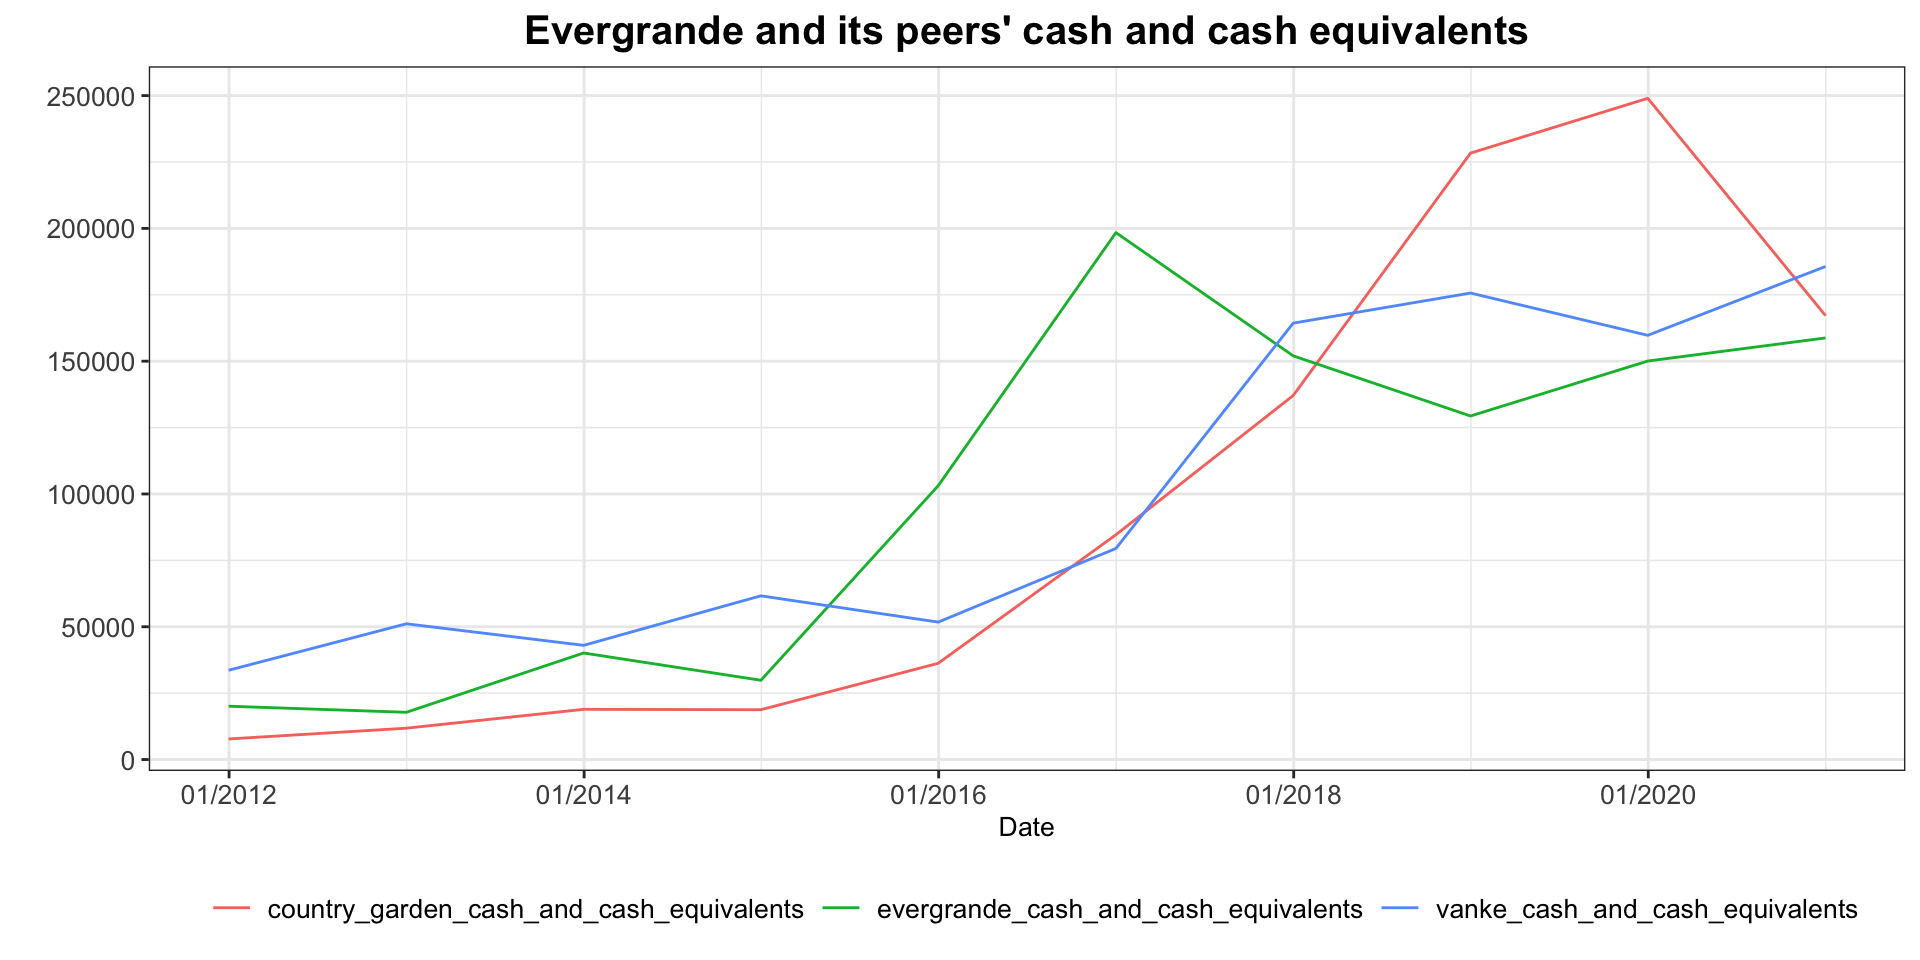
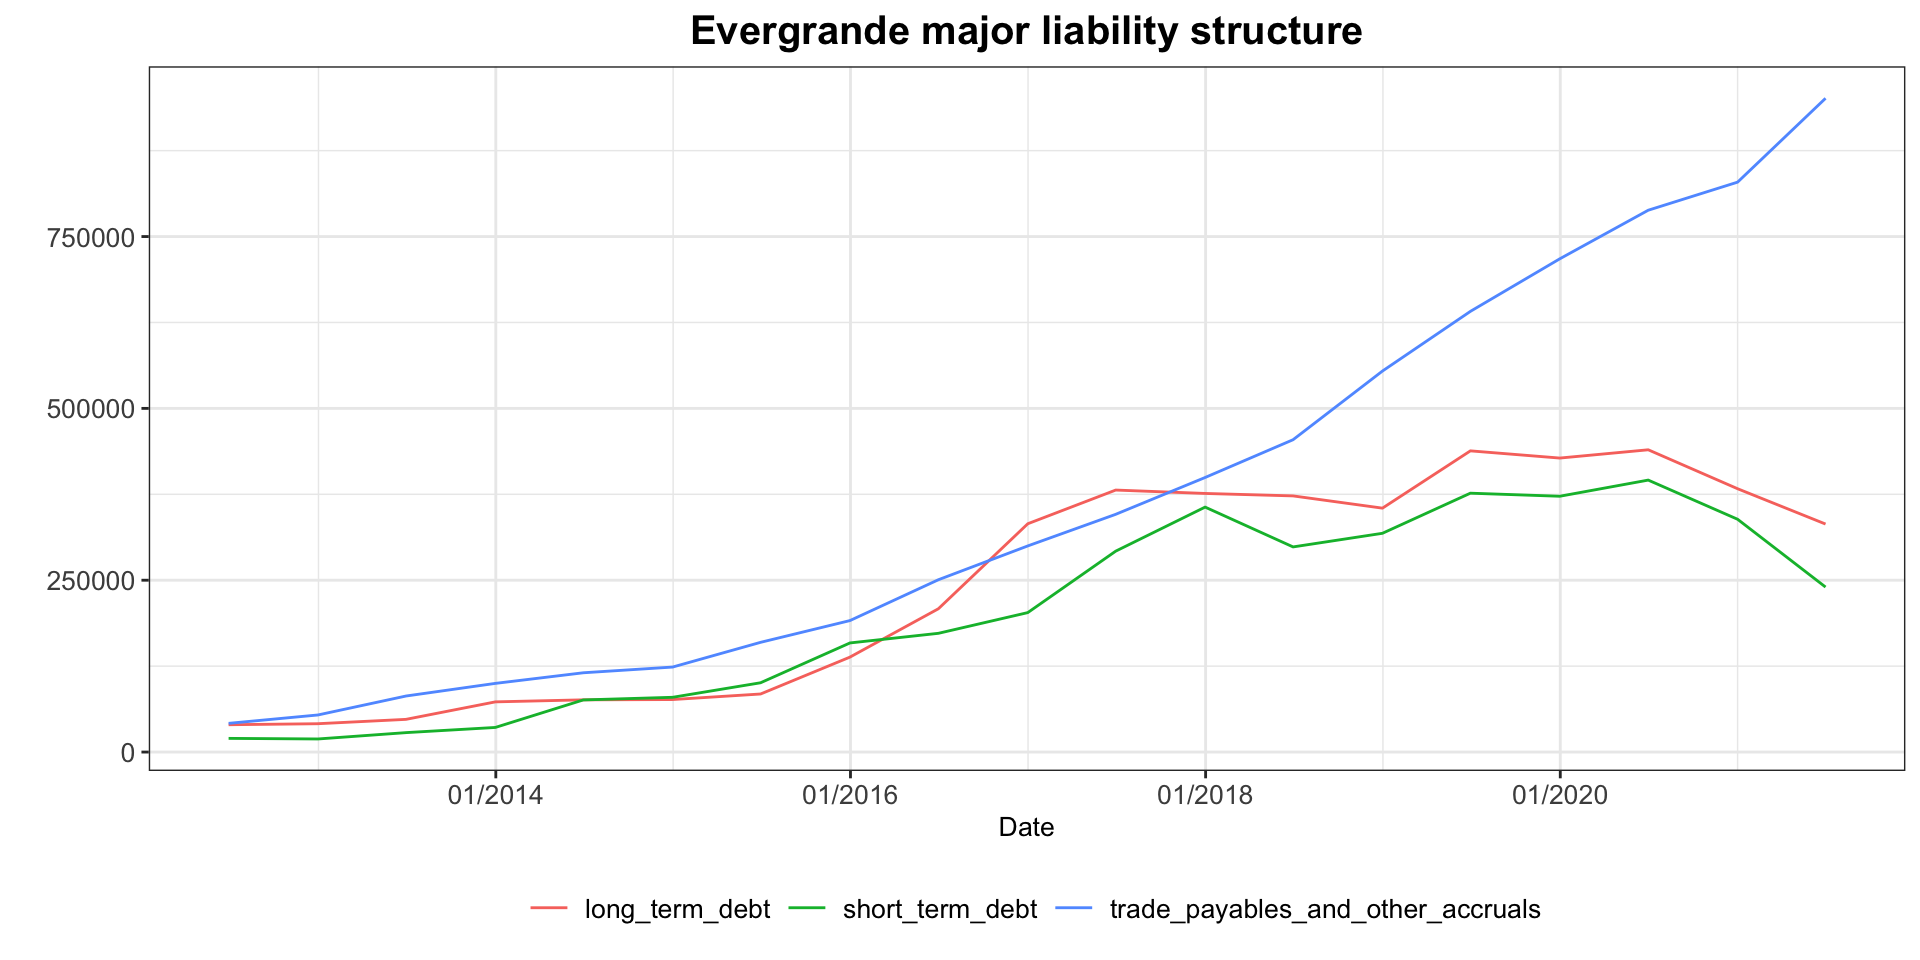
Although Evergrande’s total net debt number is steadily declining, from 538 billions at the end of last year to around 400 billions in the first half of 2021, the sum liabilities don’t decrease as Evergrande accumulates vast payables to its suppliers and contractors while it uses credit saved from it to pay back its debt. Trade payables and other accruals on its balance sheet have increased more than 14% in a half a year’s time to an aggregated 951 billions yuan, and Evergrande has only resolved about 25 billions payables with suppliers through selling its properties and parking spaces.
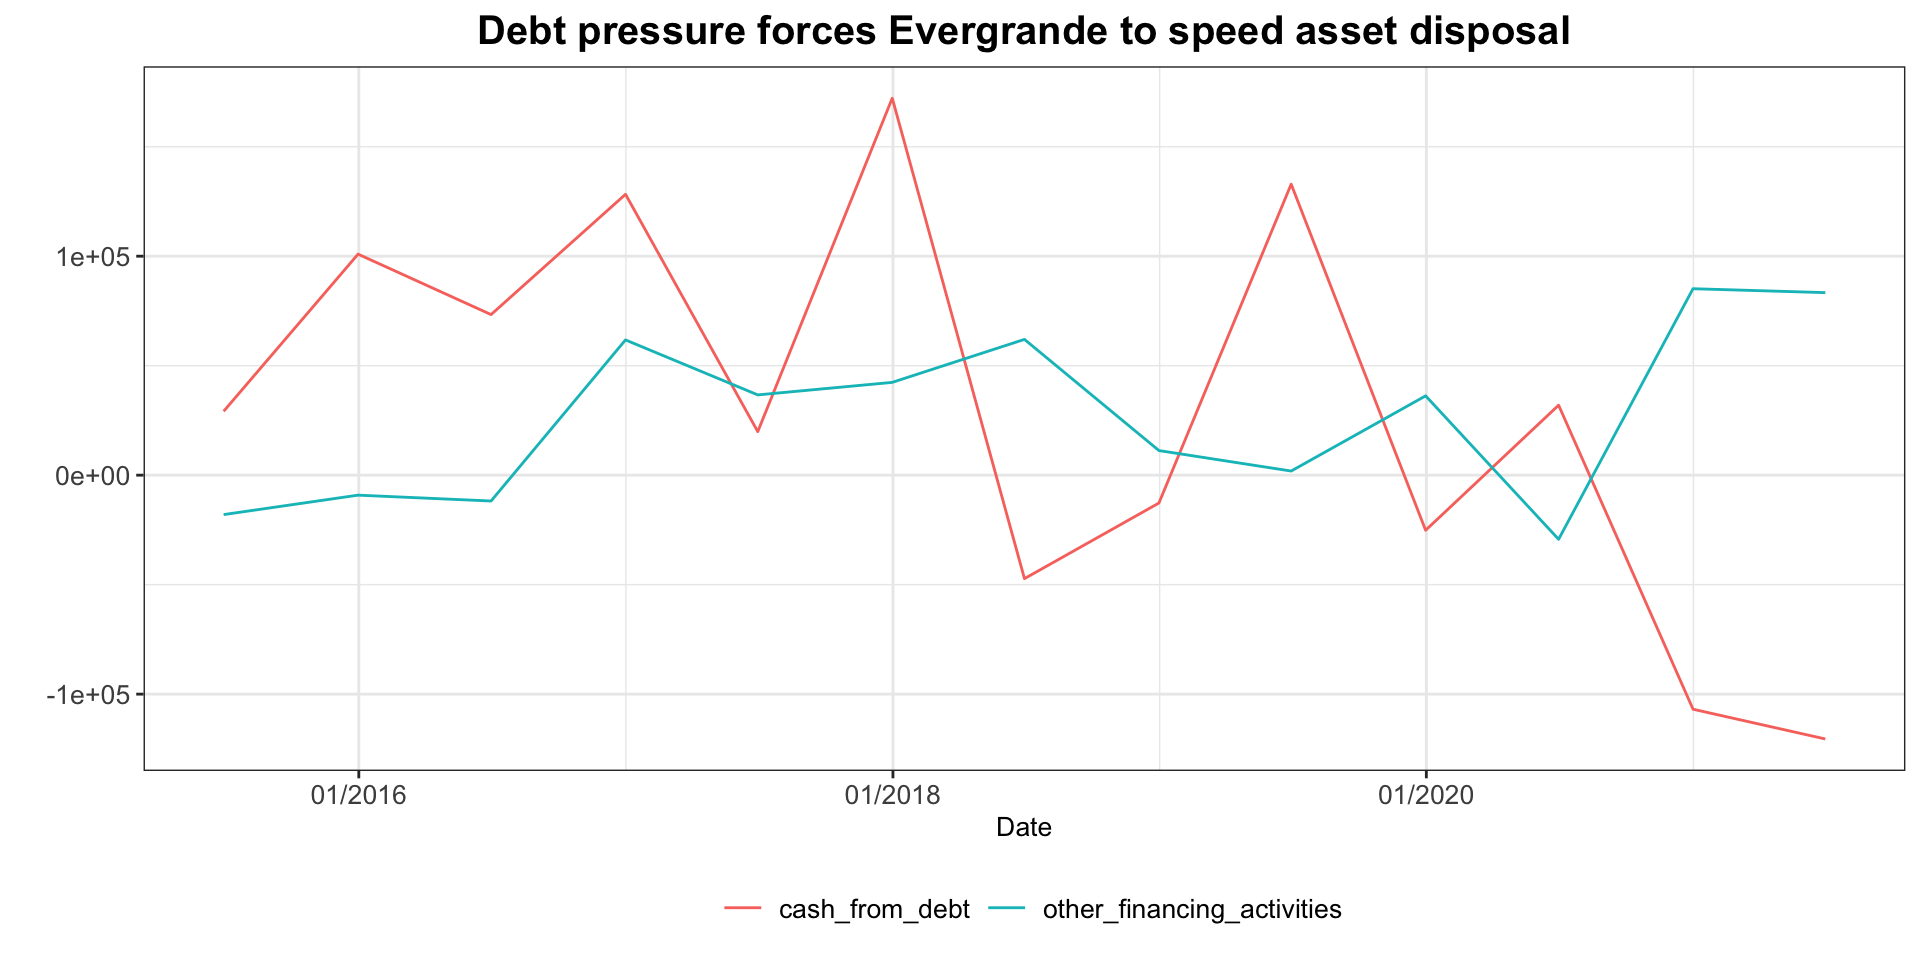
In fact, Evergrande has sold not only its properties but also equity of several subsidiaries it owns at last year and this year. Besides, it has also secured ample funds from two IPOs of its EV and property service units. According to figures provided in its mid-term report, Evergrande has raised about 14.3 billions yuan by selling stakes in business including HengTen Networks, Shengjing Bank and Evergrande Spring in the first half of year and news reported that Evergrande planned to raise 10 more billions yuan in the second half from selling its shares in the life insurance company, shengjing bank and some properties in Hong Kong. This could be seen from a sharp increase in the subject of other financing activities in the cash flow statement, which jumps from 38 billions yuan in 2019 to 56 billions yuan in 2020, offsetting the impact of a vast number of debts and the lack of new finance resources. Meanwhile, this could also be observed from the subject of other income, which climbs from 1 billion yuan at the end of 2020 to 22 billions just in 21H1.
Evergrande cash from debt subject typically rebounded cyclically every two to three periods but had recorded two largest consecutive setbacks in recent years with the net outflow surpassing 120 billions yuan in 2021H1, demonstrating how stressful Evergrande is especially when it is haunted by the influence of tightening credit policy. Moreover, the problems could possibly only be a tip of the iceberg as Evergrande could cover its operation losses through the manipulation of the capitalization of interests subject before utilizing that counteraction effect into properties under development subject to reduce its net financing costs while consolidating assets. Net financing cost of the first half was at three years low of merely 4.1 billions and a large part is owing to 31 billions interests capitalization counterbalance.
What’s more, annual depreciation of properties under development subject is extremely small compared with the size of annual interests capitalization. For example, in Evergrande’s 2020 annual report, only around 0.7 billion yuan of depreciation has been calculated into its sales costs while 69 billion yuan has been counted as interests capitalization. Much more conveniently, a decent share of investment property subject is transferred from properties under development as well, and it often reports a net gain rather than a net loss of its fair value, giving an extra enhancement of the total asset size. For instance, in 2020 it recorded a 1.2 billion net gain. By conducting these adjustments, Evergrande could increase the volume of its asset and equity by carrying out some favourable adjustments, creating perfect conditions for them to lower the level of liabilities to asset ratio and net debt to euqity ratio. However, this convenience could no longer exist given the current situation where the fair value of Evergrande’s investment property will certainly decrease due to the liquidity problem and real estate sector risk-off momentum, and so do the equity it holds in subsidiary like the EV unit, the value of which has plunged three quarters from its highest. These mean that Evergrande’s margin pressure and its cash flow situation could get worsen if no easing from central government on the credit policy. Therefore, the longer bad news surrounding Evergrande persist, the more impossible could Evergrande solve its debt problem on itself by huge asset disposals and discounted sales.
Conclusions
Looking back into Evergrande’s story, there are three more things I would like to elaborate. The first one is Evergrande’s strategy mistakes back in 2017. At the end of year 2016, the state government used the phrases “housing is for living in and not speculation” in its annual report for the very first time. Taking city Beijing as an example, six years before that time, which means year 2010 to 2016, the average housing price for the city increased more than 130% from 25000 yuan/sqm in 2010 to 57597 yuan/sqm in 2016. In the same period, real estate investment has also risen from 4826.7 billions yuan to 10258.1 billions, representing a 113% growth.
Therefore, at that time, it seems that the top management team realized that by letting real estate industry sector grow in this way, the country was merely replicating the destined tragedy as Japan asset price bubble crisis back in 1986 and the latest us subprime mortgage crisis in 2008. That’s why it implemented a variety of tense policy in the following years including squeezing trust and entrusted loans and requiring new asset management rules. However, if you take a look at what happened to the real estate investment years after 2017, it bounced back quickly after the market and developers absorbed initial shocks because the latter always could figure out ways of expanding their balance sheets and banks are willing to lend to these companies given the continuous rising housing price and the lucrative return. Moreover, growth was sluggish and the government tended to ease credit policy towards the real estate sector as it was the simplest way to boost the economy.
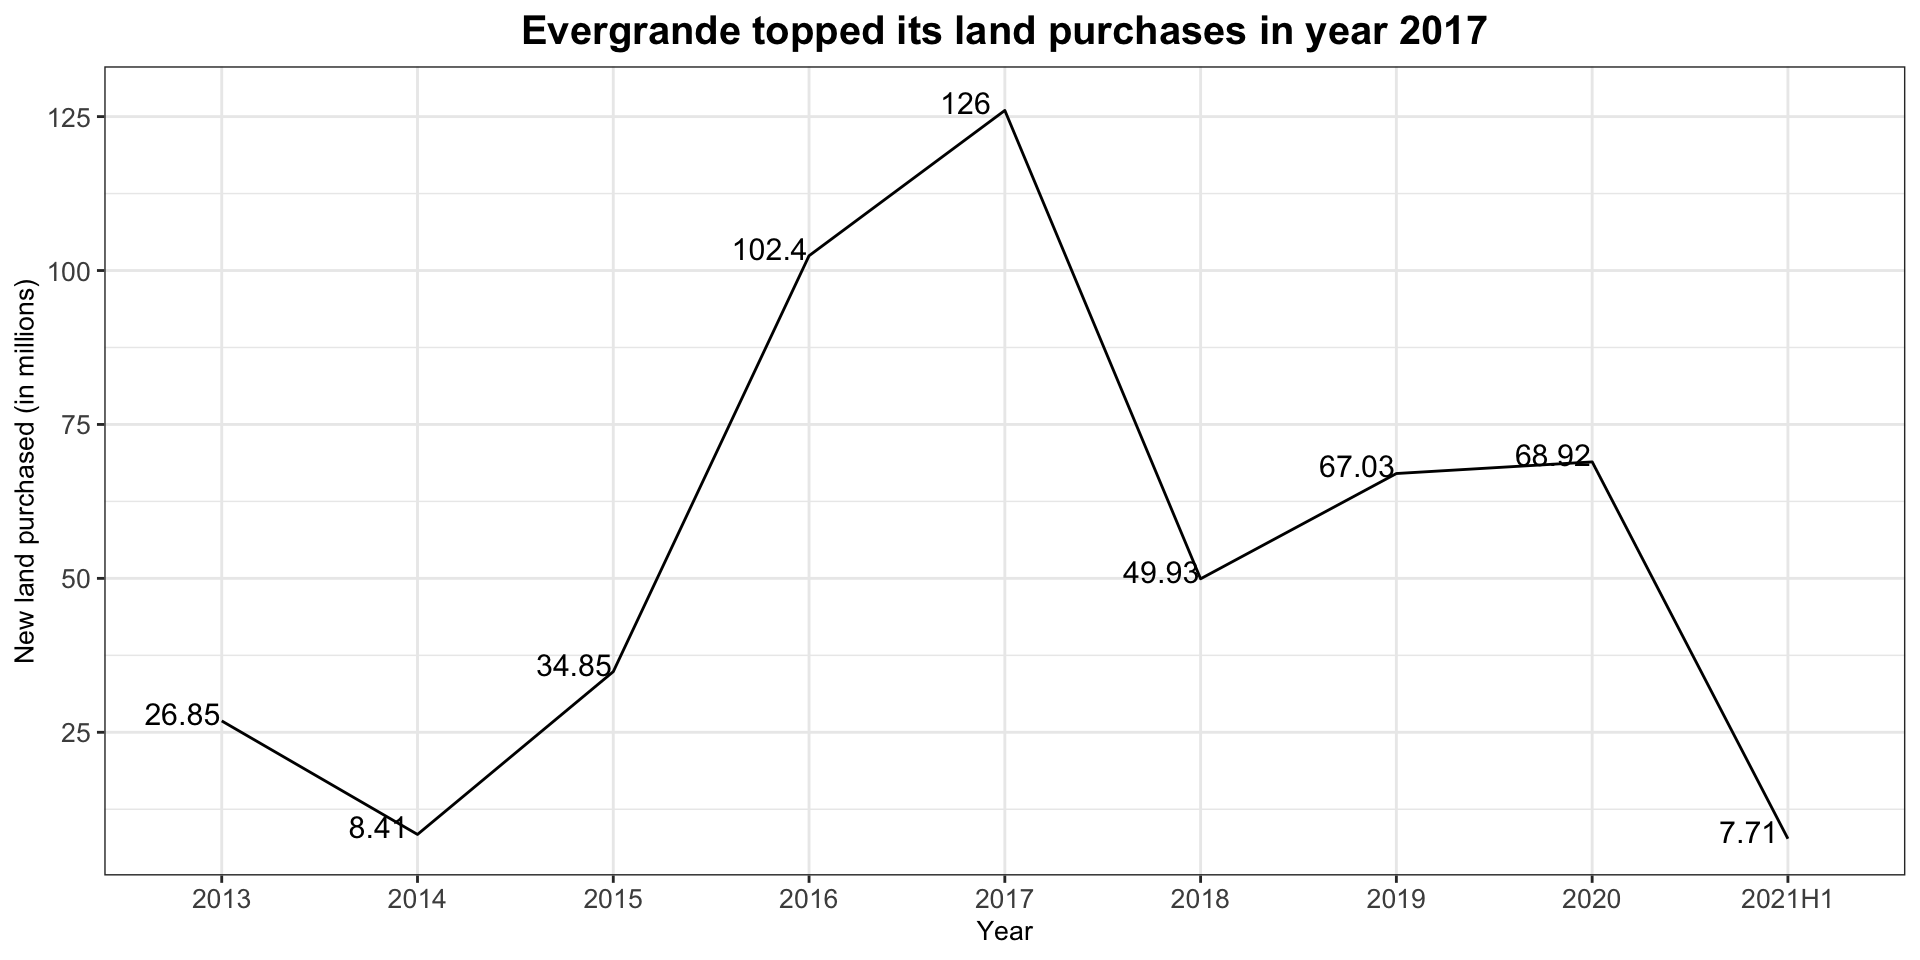
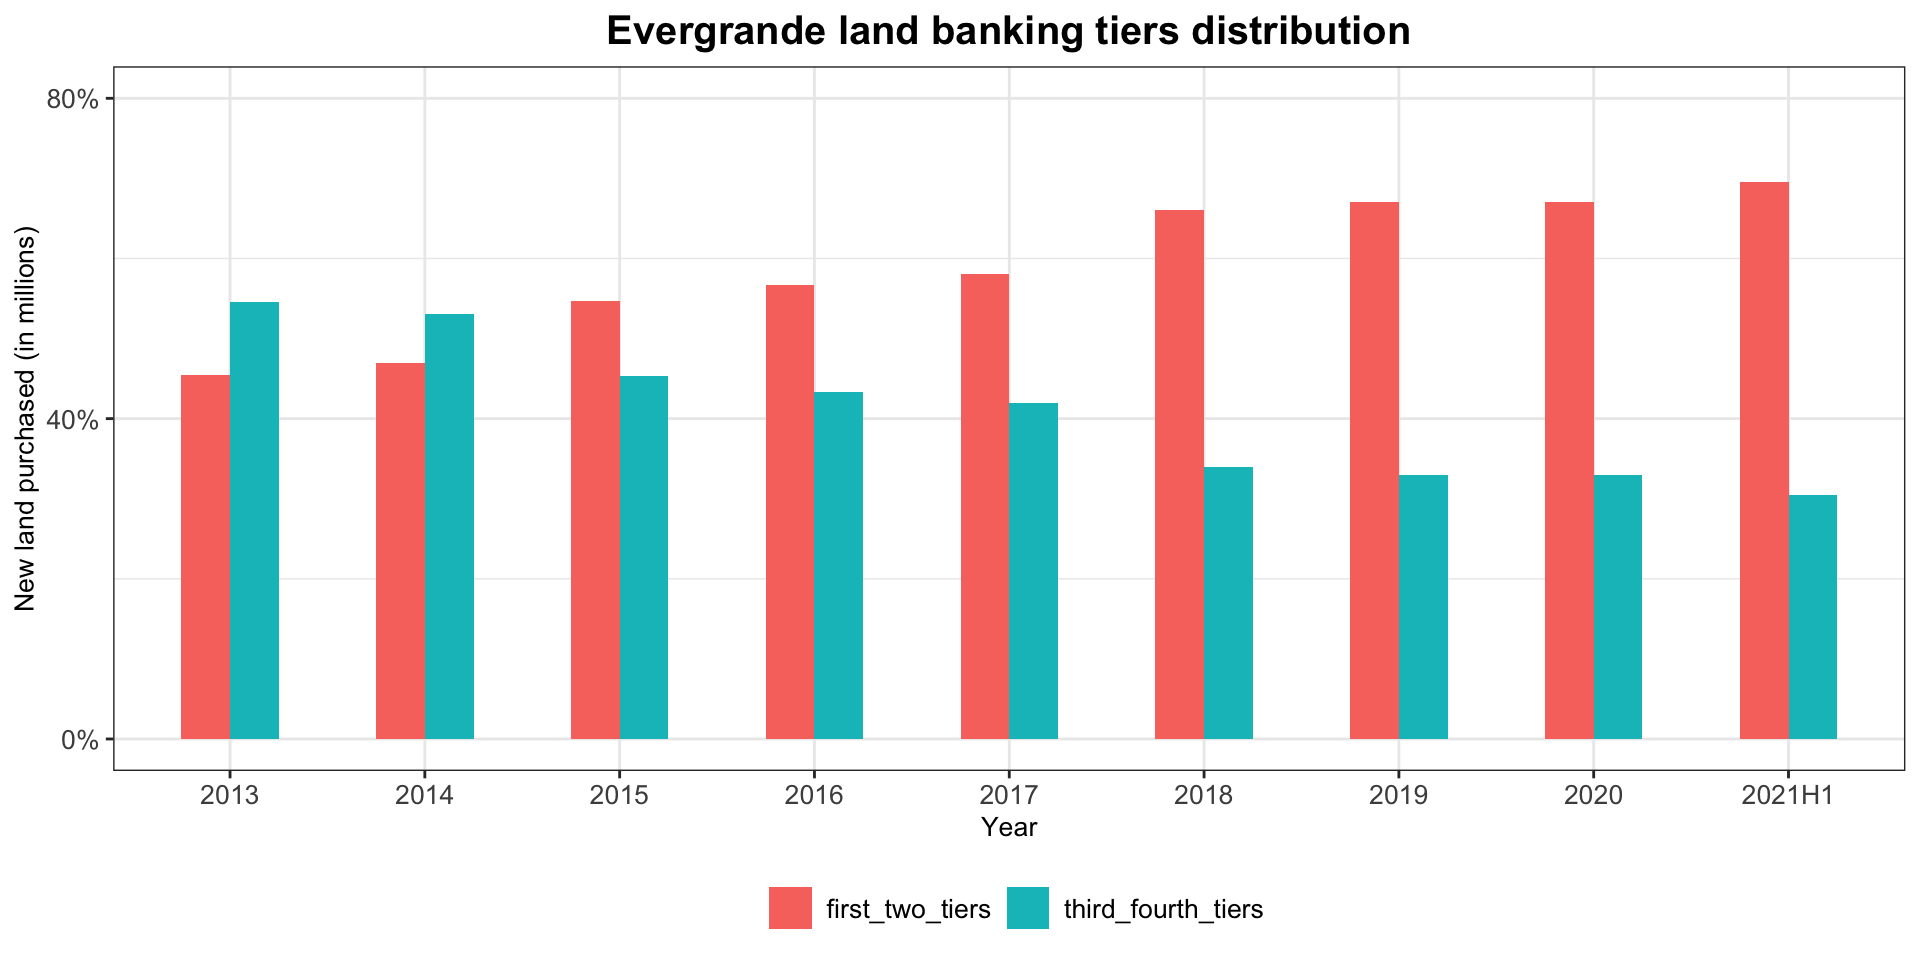
Evergrande was one of the developers who dared to run at the front by acquiring 126 millions sqm of lands in 2017, the highest number in its whole time transaction history in the year when the state government and media vocalized their concerns on the fast growing housing market. It also bought 102 millions sqm lands in 2016 thus doubled company’s land banking inventory in just two years from 156 millions sqm at the end of 2015 to 312 millions sqm later. 312 millions sqm was also the peak of company’s land banking in all time. More deadly, most of those lands had been bought from tier 3 and 4 cities because although Evergrande had stopped publishing its new acquisition distribution figure from year 2017, we could judge from the fact that since inventory percentages between 2016 and 2017 were near the same for two tiers groups even when the calculation rules had been changed from projects under development share to the net value share. In other words, by applying net value calculation rule, tier 1 and 2 cities would have a far larger percentage than 56.7% given by the Evergrande in 2016 by projects under development rule as land price in tier 3 and 4 cities at that time was significantly lower than that in tier 1 and 2. Therefore, Evergrande must had bought a large quantity of lands in tier 3 and 4 cities to make up its percentage in 2017. This is also a good example of showing how Evergrande had adjusted its reporting methods to conceal something it doesn’t want to show. One more remarkable thing, according to Evergrande mid-term report this year, the company only acquired 7.71 millions sqm in land purchasing, a nearly 90% slump from 68.92 millions in 2020, proving how nervous was the company cash flow status.
The reasons behind developers invested in tier 3 and 4 cities are based on short-term demand, not long-term reality. In the long term, real estate industry is built on the population migration picture and servicing and consuming business’s prosperity, not the short term speculation opportunity when citizens in tier 3 and 4 cities suddenly had money to spend from government’s demolition compensation. Hence, these citizens are more sensitive to changes of loan rate and policy thus reducing the demand for new properties abruptly. This could be supported by the figures regarding the inventory depletion cycle in tier 3 and 4 cities. Depletion time started to rise from August 2020 when the government announced its new three red lines policy from around 7.7 months to 14.7 months in August 2021, suggesting a 88.9% YoY increase rate. Inventory volume also rose to 14.42 millions sqm in this August. Longer depletion time in turn hurts Evergrande property sales in these cities thus hindering their efforts to get the cash back. Eventually, Evergrande paid for the price of its complacent strategy in tier 3 and 4 cities back in 2017.
Summary of Evergrande land banking history from year 2013-2021H1:
| year | new_land_purchase | land_bank_inventory | first_two_tiers | third_fourth_tiers |
|---|---|---|---|---|
| 2013 | 26.85 | 151 | 0.454 | 0.546 |
| 2014 | 8.41 | 147 | 0.469 | 0.531 |
| 2015 | 34.85 | 156 | 0.547 | 0.453 |
| 2016 | 102.40 | 229 | 0.567 | 0.433 |
| 2017 | 126.00 | 312 | 0.580 | 0.420 |
| 2018 | 49.93 | 303 | 0.660 | 0.340 |
| 2019 | 67.03 | 293 | 0.670 | 0.330 |
| 2020 | 68.92 | 231 | 0.670 | 0.330 |
| 2021H1 | 7.71 | 214 | 0.695 | 0.305 |
Evergrande land purchases transactions from year 2013 :
Evergrande land banking tiers distribution from year 2013 (projects under development rules before 2016, net value rules after 2017):
The second thing worth to be mentioned is the government policy. Since contents of policy changes and impacts have been discussed above, here I build a DID (Difference in difference) model to quantify how the implementation of three red lines policy affects the yield spread of real estate industry Yuan dominated bonds. The data was collected from bloomberg and I chose BVAL g-spread as the dependent variable as I could only analyze the policy impacts between treated and untreated group based on the same reference element. I collected BVAL g-spread in both November 2020 and March 2021 to divide time period because the three red line policy was officially implemented in January 2021. Besides, I also collected 24 transportation companies as the untreated group and 103 real estate companies as the treated group, all of these bonds will mature in year 2023 and I had also filtered out the outliers.
The tidy results of coefficients are presented in the table below. As you could see, the implementation of three red line policy is significant at 5% and causes an increase of the average g-spread of real estate industry bonds matured in 2023 by 20 basis points, demonstrating the fact that the policy created a risk premium in this sector. So far, most developers that have satisfied all three red lines requirements are state owned like CR Land, Jinmao and Poly. Highly leveraged private developers including greenland, guangzhou r&f and country garden are all facing similar liquidity issues as Evergrande did, some of them even have more severe problems than Evergrande like guangzhou r&f’s 25% cash coverage rate. Since most banks and financial institutions are owned by the state, theoretically the probability of contagion risks is low because the state government could ask banks to provide liquidity assistance to unhealthy developers and endure their risks exposure to them for longer time. But the damage has already been inflicited and performances among developers would diverge further based on their post strategy and credit conditions. A long path of recovery, restructuring and normalization just begin. Too many stakeholders will get involved in this process and it’s difficult to predict how this would come to an end because many of them have the capability to influence the whole picture. Scenarios will vary but the worst one is unlikely to appear.
| term | estimate | std.error | statistic | p.value |
|---|---|---|---|---|
| time_after | 16.05 | 7.434 | 2.159 | 0.0328 |
| time_after:policy_treated | 20.35 | 10.204 | 1.995 | 0.0483 |
At last, investors shouldn’t forget that Evergrande is still trying to save themselves at all costs. Since sales have plummeted remarkably because of negative news about the construction, the only way left for the management team to honor its coupon responsibility is by selling their assets. Till now, Evergrande had missed two coupon payments of its US-dollar dominated bonds with a combined total of 131 millions dollars. About another 1.5 billion dollars have been cashed from another sell of 20% stake at the Shengjing Bank to a state-owned company but these funds are unlikely to be given to foreign investors as reports claimed that Evergrande in fact owes 7 billions yuan to Shengjing Bank and the money it raised from this transaction will mainly be used to repay the bank. State government was also putting a lot of pressure on Evergrande by requiring the company to avoid default while ensuring its priority is to deliver property projects. Evergrande has 155 billions yuan worth of investment property on its balance sheet and it is planning to sell properties in owns in Hong Kong for another 20 billions yuan. Evergrande still has 669 millions dollars worth of coupon left to be paid in this year. Given its sales nightmare, rotten margin and tasks with different level of priority, it couldn’t be possible for it to solve all these out by itself without the assistance from the state government. PBOC has provided a substantial amount of liquidity to ease the market before the golden week and investors are waiting to see whether the state would to buy assets from the Evergrande.